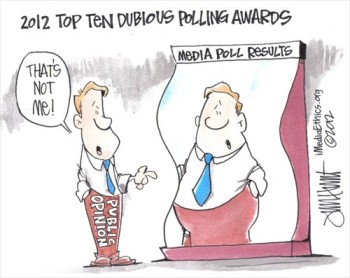
(Credit: Jim Hunt)
Polls can disregard science and even logic. The pollsters themselves often embrace entertaining headlines rather than reflect accurate public opinion. In this report, veteran pollster, author and political scientist, David W. Moore, issues the Fourth Annual Top Ten “Dubious Polling” Awards.
The 2012 awards are presented in reverse numerical order, from Number 10 to Number 1, with Number 1 being the “most” dubious.
10. Golly Gee Willikers, Batman! Polls Are Like Magic! Award
 |
| Roger Simon (Credit: POLITICO, screenshot) |
Winner: Roger Simon, Chief Political Columnist for POLITICO, for his (shall we charitably say, naïve?) comments questioning whether a national probability sample of 1,000 adults (representing only “.0003 percent of the nation at large”) can actually represent the American population. Shades of the 1930s Literary Digest, which polled a staggering 10 million voters in 1936 only to predict Alf Landon’s landslide victory over FDR! Are there really pundits out there who don’t know about scientific sampling?
Background: It’s been a long time since political commentators have thought of polls as “magic” – maybe not since 1936, when George Gallup showed that small scientifically chosen sample sizes could accurately predict national election outcomes better than a 10 million voter sample used by the Literary Digest. Since then, even the most tyro of journalists who report on polls recognize that scientific sampling does not work by magic, but rather according to mathematically proven principles.
Thus, it is a jaw-dropping moment when a reporter as experienced as POLITICO’s chief political columnist questions principles of sampling one ought to have learned in Sampling 101 in college – or in journalism school – or even by osmosis!
Simon recently penned a column in Politico, where he wrote: “Polls are predictions of the future. They are crystal balls. They are magic….Pollsters are wizards, shamans, diviners.”
OK. Maybe he’s being a bit over-the-top satirical. And besides, he does offer a couple of incisive criticisms of polls. The declining response rate is one. The fact that media pollsters poll voters nationally to predict popularity in state primaries is another.
If those were his only criticisms, I’d congratulate him rather than give him a “Dubious Polling” Award. But unfortunately, he can’t seem to get around the fact that even good pollsters use small sample sizes. He cites the results of an ABC/Washington Post poll as an example: “The new survey finds that most Americans are optimistic about their personal finances, even though gloom continues about prospects for the national economy.” But he questions the polls validity: “Is this how ‘most Americans’ — based on a survey of 1,005 of them — really feel? Dunno.”
Really?
Roger! Roger! Roger! There are many many many reasons why polls today may be suspect, but having a sample size of 1,000 is not one of them. Please…look at an elementary statistics book before you write your next column about polls and cause heart failure among your poll-cognizant fans!
9. Iowans Are Almost Like Real People Award
 |
| David Redlawsk and Caroline Tolbert (Credit: NYTimes, screenshot) |
Winners: Four scholars associated with the University of Iowa – David Redlawsk and Caroline Tolbert, for making the surprising claim in a New York Times article that “Iowans are not some exotic species” (do we really need to be convinced of this?) and then citing Michael Lewis-Beck and Peverill Squire for their statistically sophisticated conclusion that with respect to economic indicators, “Iowa is unambiguously the most representative state in the country” (who woulda thought?) and that “all things considered, there seems to be no cause to take away Iowa’s first-in-the-nation presidential selection status” (now wait just a minute – “all things considered”? – I don’t think so!).
Background: To any American voter who doesn’t live in Iowa and New Hampshire (and, really, folks, that’s almost everyone), it’s incomprehensible that these two small states should essentially determine the parties’ presidential nominees. Maybe that’s a bit of an exaggeration, but certainly these two states have a disproportionately powerful influence on whittling down the number of candidates who can compete for their party’s nomination. Why them?
Why, indeed. That’s where the four eminent scholars come in, trying to persuade us out-of-staters that after all Iowa is as much like America as any other state. Even more so! – according to Lewis-Beck and Squire, who ask rhetorically, “Is Iowa representative?” and then answer it by saying: “Yes, at least reasonably so. And when it is not, that is often because it boasts a superior performance socially (e.g., educational attainment) or politically (e.g., voting turnout).”
Wow! So, Iowa is representative of America, except when it’s not, and then it’s because Iowa is superior to the rest of the country. Now that’s state loyalty for you! And probably a lot of Iowans agree.
Outside the confines of the state’s borders, however, other people may see that red herring argument as a bit misleading. Who cares whether Iowa overall is – or is not – a microcosm of the United States? The real complaint is that (at least this year for Republicans) Iowa Caucus voters are an outlier of voters nationwide, and thus should not have the first delegate selection contest and the great influence that going first entails.
Redlawsk, Tolbert, Lewis-Beck and Squire ignore that comparison altogether. But the inconvenient truth is that Republican Iowa Caucus voters are not “like everyone else,” as claimed, but much more conservative and much more evangelical than Republican voters nationally. And that means their candidate preferences are typically much different from voters nationally.
I’m sure Iowa voters are nice people and not an exotic species, but does that mean their opinions deserve more influence than what the rest of us think? After all, we are the 99.99999%!
8. Oops! Award
 |
| Mickey Caroll: (Credit: POLITICO) |
Winner: Mickey Carroll, Director of the Quinnipiac University Polling Institute, for claiming it was not necessary to find out how many New Yorkers (in a March poll) were even aware of the Mayor’s bike lane expansion policy before asking if they approved of it. Is it really okay to ask people to rate something about which they haven’t a clue? No, Carroll wrote back to me, the poll didn’t need to ask if people knew about the issue because “it would be superfluous [to ask an awareness question] about something that had been all over the New York news.”
You’ve got to admire that kind of optimism, thinking people actually pay attention to the news. But, as it turns out, optimism and realism are not necessarily the same thing. Two months later, the Quinnipiac Poll followed my suggestion to ask an awareness question up front, and found that only 37% of New Yorkers had heard “a lot” about the expansion of bike lanes, while 26% had heard “nothing” or “not much.” So much for paying attention to the news! Oops!
Background: If we truly want to find out the state of public opinion on a given issue, it’s important to know how many people have an opinion as well as how many people are so unengaged in the issue, they really don’t have an opinion.
Pollsters tend to shy away from the non-opinion measurement, however, because it’s generally not interesting (they believe) to report that, say, a majority of the public is unengaged. That might be a realistic description of the public, but it’s more interesting to pressure people (through the use of forced-choice questions) to come up with a view – however superficial – to maintain the comforting fiction that the public is fully engaged, highly informed and totally rational in its opinion on virtually all subjects (such as bike lanes, China’s monetary policy, the situation in Damascus).
Still, often pollsters will at least precede a policy question with an awareness question – asking how much people have heard about an issue, before asking them (all of them, no matter how unaware the respondent) their view on the policy. Then, at least, we can see whether the more informed respondents are more or less likely to support a policy than the ill-informed.
In this case, when I asked the Poll Director, Doug Schwarz, why he didn’t ask an awareness question, he referred me to Mickey Carroll, the Polling Institute Director, who supplied the typical corporate response –We didn’t do anything wrong…we didn’t need the question…it would have been superfluous…thank you very much for thinking of us! But then it turns out, the corporate response was, well, not on target!
Yes – a substantial majority seemed to support the bike lane expansion, but a lot of people, in fact, had not been aware of it until told about it in the poll interview. Moreover, support for the policy declined the more people had been aware of it before the poll – suggesting the poll question itself had created a positive response. Among the 37% who knew a lot about the bike lane expansion before the poll, a majority was opposed.
Double Oops!
7. Rube Goldberg Virtual Index Award
 |
|
(Credit: Gallup) |
Winner: The Gallup Poll for its brand new, hot-off-the-presses “Positive Intensity Score”, first introduced to the Great American Public in this, the 2012, presidential election cycle! (Definitely worth a drum roll.) Unfortunately, the candidates with the highest scores over several months leading to the primary season were Michele Bachman, Rick Perry, Herman Cain, and Newt Gingrich – all losers in the first two contests.
The candidate with a persistently troubling score was Mitt Romney, even suffering a “positive intensity slump” just weeks before the voting began, causing Frank Newport, Gallup’s Editor-in-Chief, to write “Romney’s situation on this measure continues to raise questions about his positioning in the nomination fight.”
After Romney won a near-victory in Iowa and a decisive one in New Hampshire, despite his low positive intensity score, he experienced a relative surge over Gingrich in that measure going from -2 to + 11 – only to get skunked in the South Carolina Primary a couple of days later. I thought positive intensity was supposed to be …. positive!
So, is it too soon to infer that perhaps Gallup’s new Positive Intensity Score is a nugatory measure after all?
Background: For more than three quarters of a century, the country somehow survived all kinds of in-depth election analysis without ever knowing the candidates’ positive intensity scores. But Gallup decided we needed a new tool for yet more chatter about where the candidates stand relative to one another. And indeed, it’s provided a great deal of fodder for Gallup and many pundits, Gallup alone analyzing the positive intensity score in over 50 articles this year.
The measure is designed, Gallup writes, to take into account voters’ “strong emotions” toward candidates, “under the assumption that these candidates have a higher probability of motivating voters in the election.” It is calculated by subtracting the percentage of voters with strongly unfavorable feelings toward a candidate from the percentage with strongly favorable feelings, a Rube Goldberg calculation that seems to complicate the favorability measure for no obvious reason, while not really helping us estimate the candidate’s electoral appeal.
It’s also calculated only among voters already familiar with the candidate, excluding those for whom the candidate is a complete cipher and (presumably) not likely to attract many votes anyway. That restriction helps the least known candidates, who are perhaps familiar mostly to their family and close friends, where one hopes the Positive Intensity Score would be quite high – though it hardly suggests they are competitive among the larger electorate. That glitch in the Score might help to explain why Bachmann, Perry and Cain soared on this measure when they first declared their candidacies, only to see their standings plummet as the campaign proceeded and more voters go to know them.
Finally, even if the Rube Goldberg intensity score added a smidgeon of insight into voters’ feelings about candidates (and there’s no evidence it does, beyond the straight-up question that asks who the voters will support in the election), Gallup has calculated the measure only among Republicans nationally, that mythical electorate that doesn’t vote!
OK…Gallup doesn’t want to get its hands dirty by polling in unpredictable primary contests. But maybe it should reconsider predicting voter sentiment by reporting on the wrong electorate?
It’s a thought worth considering.
6. Firstest With The Leastest Award
 |
| See above CNN, NBC and AP’s polls on the release of photos of a dead Osama bin Laden. |
Winner: CNN Poll for its May 2 one-night quickie poll showing a solid majority of Americans saying the U.S. government should release a picture of the dead body of Osama bin Laden, killed two days earlier by U.S. forces. Of course release the picture! Why not? Sounds like a winner!
Problem was most Americans didn’t know whether it was a good or bad idea to release such a picture, and probably couldn’t have cared less one way or the other (but pollsters hate to measure apathy – even though it exists, it’s so not newsworthy!). Two subsequent polls contradicted the CNN poll, showing large majorities opposed to releasing a picture of bin Laden’s corpse.
What happened? CNN was first – but there was nothing to measure!
Background: Competition among the press often extends to poll stories, to see who can cover the “beat” of public opinion first with the most details, the typical effort to get there firstest with the mostest
But it takes time for public opinion to form. Not everyone hears the news at the same time, and even when people hear the news, they often don’t have a context for it. That certainly was the case with the announcement of bin Laden’s death.
Of course, that doesn’t mean polls can’t produce a semblance of public opinion. By asking forced choice questions (which don’t provide an explicit “don’t know” or “unsure” option), pollsters can pressure their respondents to come up with an opinion. And that’s what happened when CNN asked the question about releasing the picture. CNN created the illusion of public opinion, not the reality of a mostly uninformed and unsure citizenry.
A few days later, after President Obama announced he would not release a photo of the bullet-ridden body, because it could incite additional violence or be used as a propaganda tool against the United States, two new polls (by NBC/Wall Street Journal, and AP/Gfk) came to the opposite conclusion from CNN – large majorities of Americans concurred with the president, opposing release of any picture of bin Laden’s corpse. It took a few days for public opinion to crystallize, to move from no opinion to an opinion.
If we took all three polls literally, we’d have to conclude that the president’s silver-tongued oratory moved the public from a 17-point majority in favor of releasing a picture, to a 35-point margin opposed – an astonishing 52-point swing in a period of just three days!
Obama is an impressive orator, but I doubt even he believes he swayed over 50 million people to change their minds in just three days! Still, for the literalists, that’s one explanation.
Personally, I’m more persuaded that CNN simply measured non-opinion, getting the poll story first, but with the least relevance to what the public was really thinking – the firstest with the leastest.
5. Let’s Help Poor Mayor Bloomberg Award
 |
| See above a comparison of ASRL’s, Quinnipiac’s and Marist’s polls about bike lane expansion. |
Winner: The Quinnipiac University Poll and the Marist Poll for asking about the expansion of bike lanes in New York City in a way that insured results would show widespread support, thus helping the beleaguered Mayor Bloomberg in his controversial policy effort.
Background: It probably seemed like a good idea in 2006 when the Bloomberg administration promised a major increase in the number of bike lanes to deal with a high rate of fatal bicycle accidents. And, who knows? Maybe it was/is a good idea. Still, a lot of New Yorkers objected to the expansion (see here and here for some examples), eventually leading the Mayor to undertake a substantial public relations effort to convince New Yorkers that whatever their personal views, bike lanes are really good for them.
Pollsters to the Mayor’s rescue! Apparently New Yorkers already agreed with him, at least according a Quinnipiac poll, showing clear majority support for the expansion of bike lanes. Later a Marist poll reported an even larger percentage of the public in favor of bike lanes more generally. Both polls showed just 6% to 7% of the people with no opinion. And the mayor’s office touted the Quinnipiac poll as proof of the public’s support for the policy.
Unfortunately, both polls presented an exaggerated picture of a supportive public, by using biased question wording and a forced-choice format (see my critique here). A more objective and realistic survey, sponsored by the Arts Science Research Lab (which publishes this site), revealed an almost evenly divided citizenry – a little over a fifth in favor, a little over a fifth opposed – with the rest (a majority) of the public unengaged.
Less than half the population engaged and opinionated about bike lanes? Hmm…not nearly as exciting as reporting that more than 9 in 10 New Yorkers have an opinion. But that’s reality for you.
Hey guys, I know you’re not shilling for the Mayor! But the appearance is almost as bad as the reality would be. Next time, why not devote your talents to finding out what the public really thinks – and doesn’t think – about the issue?
4. We Don’t Trust Our Own Polls As Much As We Want You To Trust Them! Award
 |
| (Credit: Real Clear Politics) |
Winner: The CBS News/New York Times and the ABC News/Washington Post polls, for conducting voter surveys in Iowa weeks in advance of the election, expecting us to trust their results when we can’t verify their accuracy – but then chickening out of conducting polls in the final days of the campaign to avoid having their accuracy tested against the election itself! Cluck! Cluck!
Background: OK. Let’s get serious here. We all know it’s virtually impossible to poll accurately in a caucus election, and especially the first one in Iowa. Even before the election, up to half the voters hadn’t made up their minds, so it was anybody’s guess what would happen on election day itself. That’s why a lot of pollsters refrained from making the effort.
But six polling organizations did poll during the campaign and made final predictions. They all underestimated Rick Santorum’s final figures by about a third of what he actually got, but they made creditable predictions for the other candidates. Kudos to them!
Nine other polling organizations, however, played it cagey – polling during the campaign one or more times, but then refusing to take the acid test of accuracy by testing late poll results against the election itself. Most of them are minor polling organizations, but the two winners are arguably among the most important media polls in the country. Shame on them! If they don’t trust their own polls in the last days before people vote, why should we trust them even weeks earlier? Cluck cluck, indeed!
3. Tell ‘Em What They Want To Hear Award
 |
| (Credit: Pew) |
Winner: Pew Research Center’s Global Attitudes Project for its article about “Egypt, Democracy and Islam,” purporting to show that about six in ten Muslims in Egypt felt that democracy was preferable to any other form of government. In the wake of the uprisings in Egypt, it was a reassuring article, telling Americans what they presumably wanted to hear – that democracy was highly valued in the Muslim world. But the analysis ignored much evidence in the poll that points to a lack of a democratic culture, as well as overwhelming Muslim support for Sharia law and for executing people who dare to leave the Muslim religion.
That hardly sounds like “democracy” to me!
Background: As I noted in February 2011, the question that measured respondents’ support for democracy was hardly a paragon of objectivity:
“And which of these three statements is closest to your own opinion? Democracy is preferable to any other kind of government; In some circumstances, a non-democratic government can be preferable; For someone like me, it doesn’t matter what kind of government we have.”
(INTERVIEWER INSTRUCTION: read statements in language of interview, but always read “democracy” in English. Translate “democracy” into local language only if respondent does not understand English term.)
The question doesn’t define democracy in any way, and ignores whether people might support Sharia law in place of democracy. Oddly, the term itself is read only in English! We don’t know how respondents interpret this word.
The results of the question show 59% choosing the first option, that democracy is preferable to any other kind of government. But Pew didn’t ask respondents to characterize their own government, and for all we know, they may think their own government is a democracy.
Another possibility is that when these respondents think of “democracy” (the English word), many may think of the United States, where (by comparison) most people are financially well-off. Thus, when such respondents say they prefer “democracy,” they may actually be saying they prefer American wealth, though not its “corrupt” culture (revealed in other questions).
Besides, other questions suggest democracy as we know it is not what those respondents are thinking. An astonishing 84% of these same respondents supported the death penalty for anyone leaving the Muslim religion. Also, 82% supported stoning for adultery, and 77% supported cutting off hands for theft.
Killing people who try to change religion? Now that’s a “democracy” I’d like to avoid.
The previous year, Pew interviewed people in Sub-Saharan African countries, but in those series of surveys Pew included a question on preference for Sharia law. Countries that supported extreme punishments like those mentioned above, also showed strong support for having Sharia law be the law of the land.
Maybe having decisions being made by religious leaders is not what supporters of democracy have in mind.
What these results suggest is that the English word “democracy” may connote very different ideas among Muslims from what it means to most Americans. You think?
2. The Smorgasbord (A Poll For Every View) Award
 |
| See above a comparison of CNN, Gallup, Pew and CBS polls |
Winners: CNN, CBS/New York Times, Gallup/USA Today, NBC/Wall Street Journal, and Pew Polls, for providing a full range of answers to the question: Now that Osama Bin Laden is dead, should the U.S. withdraw its troops from Afghanistan? Two polls say Absolutely Yes! One poll says Not No But Hell No! And the other two polls say Kinda…Maybe!
Background: In the first week of May, following the successful U.S. mission to kill Osama bin Laden, all five of the above media pollsters queried the American public about their preferences for keeping or withdrawing U.S. troops from Afghanistan. And all five pollsters reported more than 90% of the public with a clear opinion – but from a 52-point margin against withdrawing troops (20% for, 72% against) to a 32-point margin in favor (64% yes, 32% no), with the other results somewhere in-between.
How could these stellar media polls, among the best in the country (if not the world), come up with such contradictory findings – all measured within a few days of each other? Were their researchers all on smack?
Here’s a clue (and it’s not about smack): The finding that 90%+ Americans had a clear view on what to do with troops in Afghanistan is, to put it mildly, not terribly likely.
Another clue: When people don’t have an opinion, they are very much influenced in their poll responses by the question itself. And each polling organization had its own (I suggest biased) way of asking the question.
So, differently biased questions asked of a mostly unengaged public led to this smorgasbord of opinions – with each pollster nevertheless firmly asserting the truth of its own results.
The New York Times’ conclusion is probably the most realistic – that the public “is not clear on when or how the United States should leave Afghanistan.” But if you don’t like that conclusion, feel free to look elsewhere – there’s a poll for every view.
1. The Rudy Giuliani Frontrunner Award
 |
| (Credit: Slate) |
Winners: All the Pollsters, Pundits, and People of the Press who – before the real voting even started – acted like political lemmings running off the cliff of reality, parroting each other in identifying first one, then another, frontrunner for the GOP presidential nomination, besides Mitt Romney.
C’mon, P, P, and PotP! It’s been obvious for months that only Romney, prior to start of the primary season, had all the requirements to be a frontrunner – the money, the organization, establishment support, the personal commitment and the poll standing. (Please note: “poll standing” is listed last!)
The other so-called frontrunners surged, at one time or another, in polls of Republicans nationally, but these national polls don’t begin to tell the full story. Ask Rudy Giuliani about his year-long frontrunner status four years ago – and how he ended up without winning a single delegate to the Republican National Convention! The polls told one story. The elections told another.
Oh, in case we’ve forgotten – it’s really the elections that count.
Background: First it was Donald Trump, then Michele Bachmann, Rick Perry, Herman Cain, still Herman Cain, and finally Newt Gingrich, who were identified as frontrunners for the GOP nomination, long before the first vote was cast in Iowa. Why? The polls told us so.
Then, after Mitt Romney’s near victory in Iowa and on the eve of his decisive win in New Hampshire, the polls told us that essentially the race was over – most GOP voters nationally now believing the former Massachusetts governor would be the eventual nominee. Soon thereafter, Romney finally stood all alone in the national polls, with a 23-pont lead among Republicans nationally.
Despite the national polls, Romney was blindsided in South Carolina, where real voters (as opposed to the mythical national electorate) began to have doubts about his candidacy and eventually handed Gingrich a double-digit victory.
As we learned four years ago, and are learning again, the national polls survey the wrong electorate – a national electorate that doesn’t exist. It’s the state electorates, namely in Iowa and New Hampshire and most recently South Carolina, which really count and set the stage for the rest of the states.
And, unfortunately for a press that wants to predict the future months in advance, even early polls in these states can’t be trusted – because most voters there haven’t a clue whom they’ll support until very close to voting day.
But that didn’t prevent our industrious pollsters from giving us many faux frontrunners throughout the fall of 2011 and into the new year. It’s like reading about Santa Claus or the Tooth Fairy – we know the stories aren’t true, but they’re sure fun to hear.
P.S. Lest you think this is all Monday morning quarterbacking, here are my Grinch-like attempts to ruin the political frontrunner fairytales for Donald Trump (April 18); Michele Bachmann (July 2); Herman Cain (Oct. 12); Herman Cain again (Oct. 27); and Newt Gingrich (Dec. 5). Rick Perry flamed out before I got a chance to write about him.
 |
David W. Moore is a Senior Fellow with the Carsey Institute at the University of New Hampshire. He is a former Vice President of the Gallup Organization and was a senior editor with the Gallup Poll for thirteen years. He is author of The Opinion Makers: An Insider Exposes the Truth Behind the Polls (Beacon, 2008; trade paperback edition, 2009). Publishers’ Weekly refers to it as a “succinct and damning critique…Keen and witty throughout


Comments Terms and Conditions