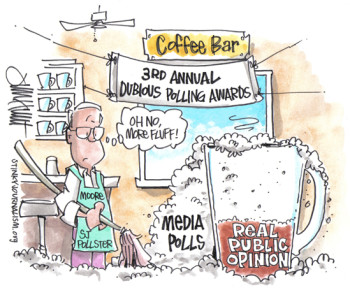
iMediaEthics Presents Pollster David Moore with his 2011 TOP TEN “DUBIOUS POLLING” AWARDS
Every year, poll watchers are confronted with poll results and commentary that defy either logic or science, often raising questions about the very utility of polls.
Typically, the problems are not with the method of conducting polls, but with the pollsters themselves – as they focus on what they believe is entertaining and appealing to the audience rather than an accurate reflection of public opinion. In the process, pollsters manipulate public opinion or write commentary that often makes a mockery of what the public is really thinking.
With this article, veteran pollster, author and political scientist, David W. Moore, issues the Third Annual Top Ten “Dubious Polling” Awards. These awards are intended to mark for posterity some of the most risible and otherwise outrageous activities by polling organizations during the previous year. This year, the awards are presented in reverse numerical order, from Number 10 to Number 1, with Number 1 being the “most” dubious.
10. “SOUR ON ROMANCE” Award
WINNER:
Pew Research’s Social and Demographic Trends Project, for reporting an 11 percentage point increase since 1978 in the percentage of American adults saying marriage is “obsolete.” But is that really true? Holy Cupid, I don’t think so! Marriage is in enough trouble in the United States without pollsters exaggerating the problem!

TIME wondered “who needs marriage?” last fall. (Credit: TIME)
BACKGROUND: Last November, a Time-sponsored poll led to a thoughtful report by Pew Research on “The Decline of Marriage and Rise of New Families.” It includes a great deal of survey and census data to trace the changing character of the American family. But one statistic came to symbolize the results: “Four in 10 say marriage is becoming obsolete.”
“If four in 10 are saying it’s becoming obsolete, they’re registering an awareness of a very important social change,” according to Pew’s study director, Paul Taylor. But was there really a 12-percentage point increase – more than a third higher that it was three decades ago? Not so, reported George Bishop on iMediaEthics last November.That finding went viral almost instantly in the global news media and on the Web. The stories inevitably included the “trend” data as well – that in 1978, just 28% of Americans felt that way.
First, the actual number in the latest report was 39%, though it was headlined as “Four in 10” or “Nearly 40%” in most news stories. So, the (alleged) increase was 11 percentage points, not 12.
Second, as Bishop pointed out, the original study in 1978 was based on registered voters, while the 39% in the current study is based on all adults. Pew’s raw data shows that among registered voters, 36% say marriage is obsolete. Thus, at most, there was an increase of just 8 percentage points from 1978.
(In its report, Pew researchers explicitly compare all survey respondents in the current survey with registered voters in 1978, giving the false impression of an 11-point increase. Shame on them! They know better.)
Finally, the question leading up to the “obsolete marriage” question was quite different in 1978 from the one in 2010. The earlier poll’s lead-up question asked “what gives life the most meaning – your work, your family, or your leisure?” With 80% saying family, they were unlikely to then say marriage was obsolete. But Pew’s lead-up question asked respondents to rate the “growing variety in the types of family arrangements that people live in,” thus encouraging a more skeptical view of marriage.
So, romantics – don’t despair! That 8-point “increase” in the number of Americans who think marriage is obsolete is probably all due to questionnaire design.
Maybe next time Pew researchers won’t be so grumpy when they design their new marriage questionnaire!
9. “HIRING THE POT TO CALL THE KETTLE BLACK” Award
WINNER:
University of Minnesota’s Humphrey Institute and Minnesota Public Radio (MPR), for having Gallup’s editor-in-chief review the Institute’s polling methodology after the final Minnesota poll in the state’s senate race was significantly off the mark. Turns out, Gallup’s own final prediction at the national level suffered the same fate! So, who chides who?
BACKGROUND: The MPR/Humphrey Institute’s final pre-election poll, conducted about a week and a half before the election, showed Democrat Mark Dayton up by 12 percentage points over Republican Tom Emmer. Dayton eventually won by just .42 of a percentage point. Heads must roll!
The Institute’s pollsters wrote a review of their methodology to explain what went wrong, but apparently they felt compelled to have a review of that review. They invited Frank Newport, Gallup’s editor-in-chief and president of the American Association for Public Opinion Research (AAPOR), to make his own independent audit of the review.
But why Gallup? What was its record in the 2010 election? As it turns out, Gallup predicted the Republicans to beat the Democrats in the national vote by 15 percentage points though the final tally was less than half that amount!
As Alan Abramowitz of Emory University wrote, Gallup’s “final poll missed the actual popular vote by the biggest margin of any major polling organization, and by the biggest margin in the history of the Gallup Poll.”
Yikes! Maybe now the Institute can conduct an independent review of Gallup’s methodology.
8. The “POLLING POLLYANNA” Award
WINNER:
Nate Silver of fivethirtyeight.com and the New York Times, for his unflagging optimism about the “uncanny accuracy” of polls – all evidence to the contrary notwithstanding! Yes, he’s brilliant – but has he really looked at public policy polls?
BACKGROUND: OK…Silver is a recent convert to polls and knows more about the numbers than about the effects of question wording and questionnaire design. A mathematical wunderkind who could probably do more complicated multivariate operations at age 11 than most Ph.D’s three times that age, his initial claim to fame came from his wizard-like analysis of baseball statistics. Now he is a widely admired psephologist, whose predictions of the 2008 election results were highly accurate. So, maybe it’s unfair to chide him for not recognizing the limits of polls, as well as the insights they can provide.
Still, is it really “uncanny accuracy” to say that poll averages can (often) predict how people are going to vote only 24 hours ahead of time? Apparently, Silver thinks so. But polls have been able to do that, more or less, for about three-quarters of a century – since George Gallup and his colleagues first demonstrated the use of “scientific” polls in the 1936 election. (It’s sooo last century to think of polls as “uncannily” accurate these days – very uncool. Like wearing a baseball hat backward. No one does that anymore.)
What about the many exceptions? Or the wildly contradictory poll results leading up to the election? While polls tend to converge just before the election, they are quite frequently all over the place during the campaign. Now that’s a cool area to focus on. But Silver never goes there.
Most quaint is Silver’s almost uncritical acceptance of different public policy poll results as though they really reflect public opinion. In discussing public opinion on the TSA’s new scanners, for example, Silver compared two quite disparate poll results – CBS saying 81% of Americans approved of the new methods, with ABC finding only 64% in support – and concluded:
“It can sometimes be misleading to compare polls from different companies, particularly since they may word their questions somewhat differently. Nevertheless, the new survey implies that public opinion on the machines may be shifting quite rapidly… about 17 percent of Americans have gone from supporting the machines to opposing them in the span of a single week.” (italics added)
Ah…the power of numbers, no matter their genesis! Silver was right in the first sentence. Question wording alone can probably account for the disparate findings.
Silver’s analysis of election results over the past two national elections is more than commendable. So, maybe in the future he’ll consider getting rid of his rose-tinted glasses when he looks at public policy polls?
7. “FOOL US ONCE, SHAME ON YOU; BUT FOOL US 64 TIMES, WE MUST BE IDIOTS!” Award
WINNER:
The Gallup Organization for its 2010 poll (the 64th year) on the “most admired” men and women in the world, after its editor-in-chief admitted last year that the list does not include the most admired after all. Never has, never will. But it’s sure fun to pretend!
BACKGROUND: As reported earlier on this site, for over six decades, Gallup has polled the American people on what man and woman living today they admire most. But last year, Gallup showed Glenn Beck to be higher on the “most admired” list than Pope Benedict, catching the attention of Dana Milbank of the Washington Post – who decried Beck’s higher rating.
Not so! claimed Gallup’s Frank Newport. The list doesn’t really measure “most admired” but rather “top-of-mind brand awareness” – or, essentially, the most well-remembered at the particular time of the survey. Awareness does not equal admiration.
Net result, wrote Newport: “I don’t think [our results] allow one to conclude that ‘Americans admire Glenn Beck more than they admire the pope,’ as in Milbank’s column.” (Note: Milbank’s column merely referred to Gallup’s list!)
Yet, a year later, using exactly the same methodology, Gallup is back touting its “most admired” list once again! This time Beck is listed higher than the Dalai Lama – but there’s no cautionary note from Newport.
And the media don’t acknowledge the fakery.
Fooled yet again? Now whose fault is that?
6. “TRY HARDER NEXT TIME” Award
WINNER:
Rasmussen and its subsidiary, Pulse Opinion Research, for their wacky predictions in the 2010 elections – including one in Hawaii which was off by 40 percentage points! Boy, when this pollster’s wrong…he’s really really wrong!
BACKGROUND: As Nate Silver wrote after the 2010 mid-term election, “Every election cycle has its winners and losers: not just the among the candidates, but also the pollsters.”
This year, Rasmussen has the honors. In the final three weeks of the campaign, Rasmussen released the results of 105 polls, with an average error of 5.8 percentage points and an average bias in the Republican direction of 3.9 percentage points – far worse than other polls.
In its most outlandish poll, taken in mid-October, Rasmussen showed incumbent Democrat Daniel K. Inouye leading his Republican opponent Cam Cavasso by just 13 points, though Inouye won by a 53-point margin, “the largest error ever recorded in a general election in FiveThirtyEight’s database, which includes all polls conducted since 1998” (writes Nate Silver).
That brings to mind a poem by Henry Wadsworth Longfellow: “There was a little girl, who had a little curl, right in the middle of her forehead. When she was good, she was very good indeed, but when she was bad she was horrid!”
Back to Rasmussen – he hasn’t always been this bad. According to Silver, “Rasmussen’s polls — after a poor debut in 2000 in which they picked the wrong winner in 7 key states in that year’s Presidential race — nevertheless had performed quite strongly in 2004 and 2006. And they were about average in 2008. But their polls were poor this year.”
Better luck next time!
5. “TAX ME, TAX ME NOT…” Award
WINNER:
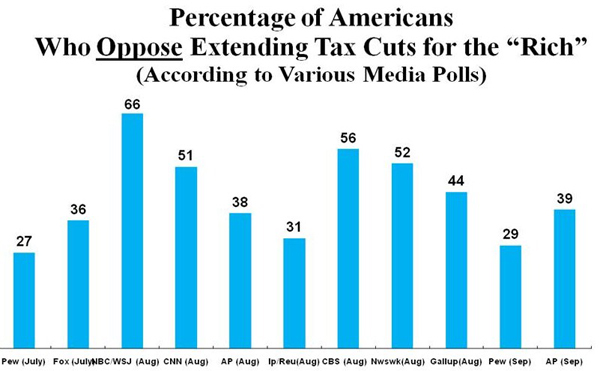
Polling organizations of Fox, NBC/Wall Street Journal, CNN, Ipsos/Reuters, Newsweek, Gallup, Pew and Associated Press – for their madcap reports on extending tax cuts for the “rich” – from 27% opposed to 66%, and anywhere in-between. Pick your poison! We sell ‘em all!
BACKGROUND: Did Americans support or oppose extending the Bush-era tax cuts to incomes over $250,000? Oddly, that question was never asked. Instead, the issue was posed as extending tax cuts to rich people vs. extending the tax cuts only to middle class people. But in real life, the options were to extend tax cuts for everyone – at least up to earnings of $250,000 – or to extend tax cuts also on incomes above that level.
This is not a trivial distinction, because several of the questions, asked of a largely uninformed public, implied that extending the tax cuts only on the lower incomes would mean no tax cuts for the rich – which was not the case. They would also get tax cuts on the first quarter of a million dollars of their earnings. But, by formulating the issue that way, pollsters tapped into respondents’ desire to be “fair,” encouraging them to say they wanted tax cuts for “everyone.”
Still, the polls were able to come up with wildly different results, even though all used similarly misleading question wording.
Polls asking if Americans are against extending tax cuts for the “rich” have produced varied responses depending on who took the polls.
 |
| Polls asking if Americans are against extending tax cuts for the “rich” have produced varied responses depending on who took the polls. |
So…a poll for almost every taste! And, most important, they’re all “scientific”!
4. The “I ♥ ARIZONA” Award
WINNER:
Polling organizations from CBS News/New York Times, Fox, CNN, Pew, ABC/Washington Post, NBC/Wall Street Journal, Gallup, Associated Press/Roper Public Affairs and Media, and Ipsos/McClatchy for creating “immigration poll majorities” about the strict Arizona immigration law signed into law last April. Truth be told, large segments of Americans had no idea what the law did. So why did many such people support the law? Maybe they just like Arizona!
BACKGROUND: After Arizona enacted a controversial immigration law last year to address the problem of illegal immigrants, pollsters immediately began measuring the general public’s reaction. Problem is – a large proportion of Americans didn’t know what precisely the law entailed. But that didn’t prevent pollsters from creating majorities anyway.
We know the public was ill-informed on the issue, because one organization initially tried to gauge how much the public knew. The month after the law was passed, a Fox News/Opinion Dynamics poll showed close to half of the public admitting they didn’t know enough about the law to have an opinion:
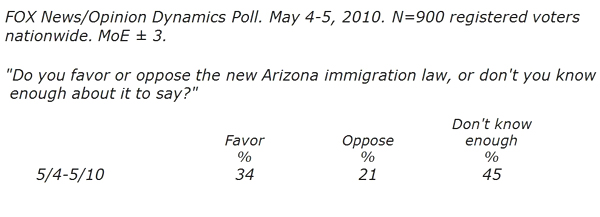
Fox News/Opinion poll on the Arizona immigration law. (Credit: Pollingreport.com)
Other polling organizations used the “forced-choice” format, pressuring respondents to offer an opinion whether or not they actually had one. Result: large majorities in those polls said yes to the law! Why not? Knowing only that Arizona passed the law, and assuming there must be a reason, why not say “support”?The key here was the question, which explicitly offered the option, “or don’t you know enough about it to say?” When people are told it’s okay to say they are unsure about an issue, many are willing to do so.
Of course, later Fox saw the error of its way, and in subsequent polls adopted the prevailing practice of asking the forced-choice question. And it worked. Fox, too, could report majorities in favor of the law.
But I still think it’s because they like Arizona.
3. “STATE OF DENIAL” Award
WINNERS:
Tom Rosenstiel and Scott Keeter of Pew, for their bravado in simply denying the limits of a poll of journalists outlined by their pollster, who said “the results are not projectable to any population other than the journalists in this sample.” He’s wrong, they claimed, all evidence to the contrary…and later they got him to agree. Now, that’s a state of denial worth having!
BACKGROUND: As covered in more detail on this site, Tom Rosenstiel, director and founder of Pew’s Project for Excellence in Journalism, wrote an article based on a recent Pew poll, in which he reported the findings as though they applied broadly to “America’s news executives.” The problem was that the polling organization that conducted the survey, Princeton Survey Research Associates International (PSRAI), said the results could not be used that way.
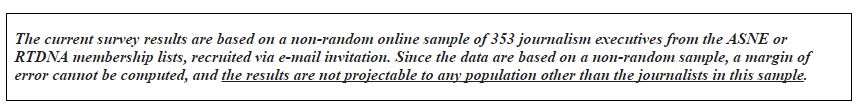
“Topline” method statement which makes clear that poll results cannot be generalized to “America’s editors,” as author did. The statement was bolded and italicized (I added the underline for this article), suggesting the pollster wanted to be sure Pew understood the limits of the poll’s sample.
According to the methodology statement, the poll results could not be treated as though they represented “America’s editors,” nor could the results be treated as though they represented the memberships of the two professional organizations.
When iMediaEthics brought this to Rosenstiel’s attention, he first denied that he had treated the results as though he had a representative sample (“we didn’t intend to suggest this was a scientifically representative sample”), but the next day he denied the denial, saying “we believe that the results of the survey represent the members of the two leading newspaper and broadcast trade organizations [ASNE and RTDNA] ….”
The sample of journalists included in the survey was based on a list of journalists provided to PSRAI by two professional organizations, the American Society of News Editors (ASNE) and the Radio Television Digital News Association (RTDNA). According to Evans Witt, president of PSRAI, that list did not include all the email addresses of the journalists, and thus was a non-random (non-representative sample).
But that evidence didn’t faze Keeter. He simply denied it. “In reviewing the study after an inquiry from David Moore,” he later wrote to Pew Board Chairman, Donald Kimmelman, “it was clear to me that this was, in fact, a representative survey of the membership of these two organizations.”
The problem was that it could only have been a “representative survey” if PSRAI was able to solicit all members of the association to participate, and to do that it needed all their email addresses (the survey was online) – which PSRAI admitted it did not have.
But Keeter simply posted a new methodology statement on the Pew website, denying the limitations outlined by PSRAI, saying that the survey was in fact a representative survey. Surprisingly, Witt agreed – though he had no information to counter his original caution about the use of the sample.
In his letter to Kimmelman, Keeter was (shockingly) candid: “The one issue we had trouble resolving was whether all members of the associations were reachable by e-mail or not, as the revised methodology statement said.” In short, when he posted his revised methodology statement, he had no idea if it was correct! That is quite an admission from Pew’s Director of Survey Research. It makes you wonder how many other posts on Pew’s website haven’t been verified.
Thirty-four days after posting the “revised methodology statement” claiming a representative sample, Keeter announced that “at long last” he had heard back from ASNE and RTDNA – and these two organizations (after being asked again about the nature of the lists they had provided, because of iMediaEthics’ inquiries) now claimed that all members of their organizations had provided email addresses! How about that? Problem solved – thanks to the change in description by ASNE and RDTNA.
There is a lesson here – perhaps if we deny something long enough, it actually becomes a reality!
2. “CLIENT LOYALTY” Award
WINNER:
Evans Witt, CEO of Princeton Survey Research Associates International (PSRAI), for unwavering loyalty to his client, Pew Research, when its researchers wanted to change the methodology statement of one of its polls. Someone less devoted to his clients might have insisted on adhering to the original description, which appeared to be based on solid evidence. Lucky for Pew that didn’t happen!
BACKGROUND: As described in the “State of Denial” Award, and in more detail on this site, Pew’s researchers took issue with Witt’s characterization of a poll sample, as one that did not allow the results to be projected to any population other than the people actually interviewed.
Usually, samples are relatively small groups of respondents, who are chosen in such a way that they represent some larger population. In this case, the intent was to have a sample that was at least representative of two professional journalists’ associations, the American Society of News Editors (ASNE) and the Radio Television Digital News Association (RTDNA). But the list of names provided to Witt did not, according to Witt, include the email addresses of all members. Thus, Witt (reasonably) concluded, the sample was “non-random” and could not be treated as a “representative” sample. He made that explicitly clear in the methodology statement posted on Pew’s website.
However, the Pew researcher who reported on the results, Tom Rosenstiel, simply ignored the caveat and asserted in the article that the results applied to “America’s editors” more generally, or at the very least to the members of the two professional organizations.
When queried about the discrepancy, Rosenstiel called upon Pew’s Director of Survey Research, Scott Keeter, and Witt to address the issue. Instead of having Rosenstiel modify his article to conform to the limits of the study, the Pew researchers decided instead to change the methodology statement to conform with the report – a kind of cart before the mule adjustment.
With apparently no new evidence to justify such a change (though asked on several occasions if there was any new information), Witt nevertheless readily acceded to a new methodology statement. This one asserted that all active members of the two professional organizations were solicited, thus converting the sample into a “representative” sample of the organizational memberships after all.
But how could they say they had solicited all members, when they didn’t have email addresses for all members? As Witt wrote, even after the new methodology statement had been posted:
From: Evans Witt [mailto:evans.witt@psra.com] Sent: Tuesday, May 25, 2010 3:46 PM
To: David Moore
Cc: Scott Keeter
Subject: RE: Nature of membership listsDavid,
It has been crystal clear from the day this research was released that the news executives on the lists were invited by email to participate and that the interviews were conducted online. That does indeed mean that news executives without email were not included. It also means that news executives without internet access were not included. And that does means that members of the ASNE and RTDNA who did not provide email addresses or who do not have internet access were not included. [emphasis added]
OK…I get it.
The new methodology statement contradicted the evidence that Witt had. So, Witt must have gone along with the change not because he had new information, but simply because Pew wanted the change. Not many clients would find such a cooperative pollster.
Later, of course, the new information that Keeter obtained from ASNE and RTDNA contradicted Witt’s description above. Now the two professional organizations were saying that they had provided email addresses for all active members.
But that was 34 days after the new methodology statement was posted – with no assurance that ASNE and RTDNA would change their characterizations of the sample. Suppose they hadn’t changed their minds? It was quite a risk to take.
How many pollsters would go this extra mile for their clients? Not many, I suspect. It’s a truly steadfast commitment.
1.“TOWER OF BABBLE” Award
WINNER:
The Major Media Polls, for their variegated polling results on the most significant piece of legislation passed in 2010 – the new health care program. The many shades of opinion provided by the polls were a boon to the pundits and politicians, who – as Mark Blumenthal noted – could find “a poll for every side.” Babble on!
BACKGROUND: Now, really folks, is it even possible to measure public opinion on such a complex topic? OK, we can ask if people “approve or disapprove” of the whole package, or whether they feel “favorable” or “unfavorable” about it, but how many people even know what’s in the whole package or how it would affect them?
The Kaiser Foundation asked the latter question shortly after the law had been passed, and a majority – 56% — said they did not have enough information to understand how it would affect them. About the same time, CBS reported that 59% of Americans said they found the new law either “confusing” (53%) or they didn’t know whether they understood it (6%).
Of course, what people know or don’t know about an issue is irrelevant to most pollsters. Just ask away! Ignorance-based polls are all the rage these days.
A good average of (mostly) such polls can be found on Pollster.com — now on HuffingtonPost. It provides a trend of positive/negative views of the overall health care package, though the questions used by each polling organization are often quite different from each other.
The Pollster trend includes all polls, so there is at least one noteworthy exception to the general approach. The AP/KnowledgeNetworks survey in September, for example, offered respondents the option of saying they didn’t have an opinion, and the results are quite different from the general run-of-the-mill media poll.
Perhaps the most revealing aspect of this different approach was that a large majority of Americans said they have no strong feelings, one way or the other, about the overall health care package itself. Just a third of Americans feel strongly: 9% in favor, and 23% opposed. Another 30% say they are completely neutral (neither favor nor oppose the law), and 38% express tepid feelings – 21% in favor, 17% opposed.
In short, about two-thirds of Americans do not feel strongly one way or the other on the new health care law, with 30% strictly neutral.
But where in the news media – left, center, or right – do we see that picture of a mostly ambivalent public?
Instead we are shown pictures of an American public that is fully engaged, informed and opinionated – though often in conflicting directions.
A July CBS poll, for example, reported that 36% of Americans approved of the new health care law, while 49% disapproved – a net 13-point margin against the law.
Conducted over virtually the same time period, a Kaiser Foundation poll found 50% of Americans favorable toward the law and 35% unfavorable – a net 15-point margin in favor of the law.
Thus, over essentially the same time frame, there was a 28-point gap between the two polling organizations in the net positive/negative feelings toward the law! Both found just 14% to 15% of Americans undecided.
Apparently, it’s just not newsworthy to report a public that is largely confused, uninformed, inattentive and ambivalent – especially when talking about one of the most salient public policy issues of the past year.
So, let’s keep those polls coming, with their conflicting results that can satisfy all sides of the arguments. Babble on, Babylon!
UPDATE: 1-28-2011, 4:04PM EST: We clarified in the introduction that this year’s awards are presented in reverse numerical order, from Number 10 to Number 1, with Number 1 being the “most” dubious.
 |
David W. Moore is a Senior Fellow with the Carsey Institute at the University of New Hampshire. He is a former Vice President of the Gallup Organization and was a senior editor with the Gallup Poll for thirteen years. He is author of The Opinion Makers: An Insider Exposes the Truth Behind the Polls (Beacon, 2008; trade paperback edition, 2009). Publishers’ Weekly refers to it as a “succinct and damning critique…Keen and witty throughout.”


Comments Terms and Conditions