
Understanding New Yorkers on Bicycle Lanes: How the Quinnipiac and Marist Polls Mislead
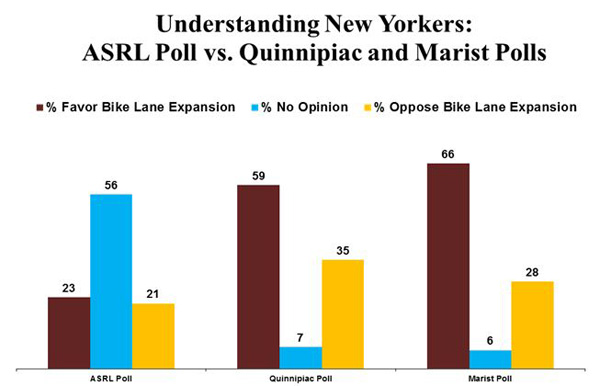
If we are to believe two polling organizations, New York City residents are overwhelming supportive of the city’s efforts to expand bicycle lanes. A Quinnipiac poll reports a 24-point margin of support, 59% saying the expansion is a “good thing” and 35% saying it’s a “bad thing.” Marist claims an even higher margin of support (38 points), with 66% expressing support and 28% opposition to the bike lanes.
A new ASRL (Arts Sciences Research Laboratory) Poll,* however, suggests a quite different picture of the public. Using objective questions to measure opinion, including how intensely residents feel about the issue, the ASRL Poll finds a majority of New Yorkers (56%) indifferent on the issue (not caring whether or not there is an expansion), with the rest of the residents about evenly divided – approximately one fifth (23%) intensely supportive and another fifth (21%) intensely opposed.
 |
Quinnipiac Poll vs. Reality
Quinnipiac was the first to poll on the issue back in March when it announced that New Yorkers supported the expansion of bike lanes in the city by a 54% to 39% margin.
At the time, I took issue with the findings, suggesting that Quinnipiac was stacking the deck by the wording of their questions. I also suggested that they needed to measure how many people have even heard of the issue, what experience they personally have had, if any, with the new bike lanes, and how intensely they feel about the issue.
Since then, Quinnipiac has conducted two more polls: one in May and another in July. In response to my criticisms, the Quinnipiac pollsters now include a question that measures how much people have heard about the expansion of bike lanes.
(When asked why they didn’t include such a question the first time, Mickey Carroll, Director of the Polling Institute, responded via e-mail: “We didn’t ask an ‘are you aware’ question because it would be superfluous about something that had been all over the New York news.” Apparently, it wasn’t a superfluous question after all, because when they did ask it in their next poll, they found only about a third (37%) of New Yorkers who had heard “a lot” about the issue. Moreover, support declined the more people knew about the bike lanes. In fact, even with their biased question, a majority of those who had heard “a lot” about the issue actually opposed the expansion.)
Still, Quinnipiac has ignored my other criticisms, continuing with the use of their biased question about the expansion of bike lanes, and refusing to measure intensity of opinion. Research has shown that many people will offer an opinion in a poll, even though – if given the option – they will readily admit they really don’t have a preference one way or another. To understand the public, it is crucial to measure whether people are firmly anchored to their opinion or not.
With the continued use of their biased question and refusal to measure intensity, Quinnipiac reported an “increase” in public support in July, with 59% saying the expansion of lanes was a “good thing,” compared with 54% who said that the previous March.
ASRL Poll vs. Quinnipiac Poll
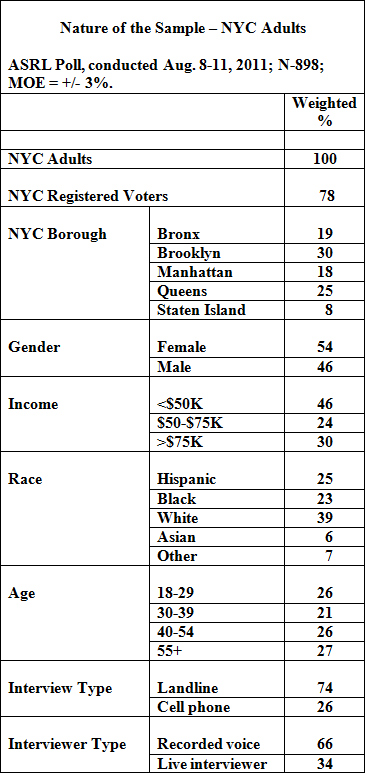
It’s one thing to hypothesize that the Quinnipiac Poll is biased. It’s another thing to demonstrate it in practice. In order to illustrate the principles of polling we think are important, the Art Science Reserach Laboratory (ASRL) contracted with SurveyUSA to conduct a poll of New York City residents on the subject of bike lane expansion, following a methodology that we believe produces a more realistic picture of the public.
SurveyUSA interviewed 898 city adults from Aug. 4-8 using voice-recorded interviewers for 66% of the interviews and live interviewers for the rest.
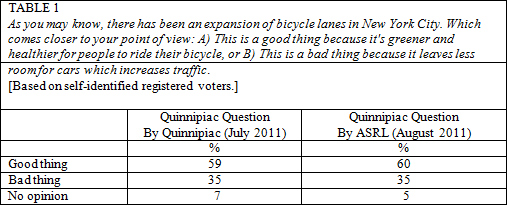
Half the sample of respondents in the ASRL poll were asked the Quinnipiac question, and the ASRL results were virtually identical with what Quinnipiac reported in its July poll. Among registered voters, Quinnipiac reported that 59% felt the expansion of bike lanes was a “good thing,” and 35% a bad thing, while ASRL found comparable figures of 60% to 35%.
 |
What these results demonstrate is that both the ASRL poll and the Quinnipiac poll reached approximately the same types of New York City residents. Though two-thirds of the ASRL respondents were interviewed by recorded voice and a third by live interviewers, while all of Quinnipiac’s interviews were conducted by live interviewers, the mode of interviewing apparently had no effect. ASRL got virtually the same results as Quinnipiac when using the same question.
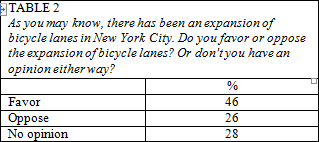
For the other half of the sample, ASRL asked its own question about bike lanes. Unlike Quinnipiac, ASRL offered an explicit “no opinion” option. The Quinnipiac question used a “forced choice” format – accepting a “no opinion” response only if volunteered, but not offering one explicitly. This approach subtly “forces” (pressures) the respondent into accepting one of the two acceptable options, thus underestimating the percentage of people with genuine non-opinions.
The net result is that respondents asked the ASRL question (which gave an explicit option to say they had “no opinion”) were much more likely to admit they didn’t have an opinion — 28% compared with just 4% who were asked Quinnipiac’s forced-choice question.
 |
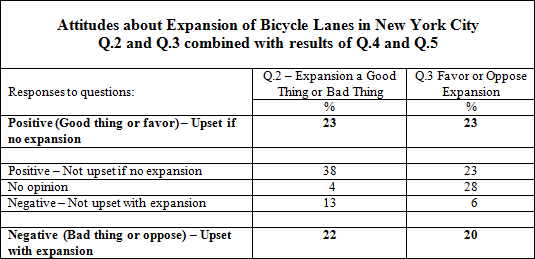
Though “no opinion” was offered in the question, it’s still essential to measure “intensity” of opinion. Many people may express an opinion, but often they do so without any real conviction. Especially in the context of a survey, where people are expected to have an opinion (that’s the whole point of the poll, after all), many respondents may come up with an opinion to meet interviewer’s expectations, but still not really care about the issue one way or the other.
To determine if that was the case, we asked respondents who said they favored the expansion of bicycle lanes how upset they would be if there were no expansion. And we asked people who opposed the expansion how upset they are because of the expansion.
These follow-up questions were asked of the full sample of respondents who indicated a positive or negative view of the bicycle lane expansion – including respondents who were asked the Quinnipiac question as well as respondents asked the ASRL question. (The questions weren’t posed to respondents who stated they had no opinion on the bike lane expansion.)
The scale for the upset question was: very upset, somewhat upset, not too upset, or not at all upset. People who said “very” or “somewhat” were classified as “upset,” while people who said “not too” or “not at all” were classified as “not upset.”
Respondents who say they are “not upset” with the opposite policy from the one they just said they preferred are classified as people with essentially “non-opinions.” The logic here is straightforward: People who say that they “oppose” the expansion of bike lanes, but then readily admit that they aren’t upset that there is an expansion, are apparently not concerned about the issue one way or the other. Their initial opinion, we can surmise, was a top-of-mind response, with no real impact on their way of thinking.
The same logic holds for people who say they “favor” the expansion of bike lanes, but then say they wouldn’t be upset if the expansion did not occur. For practical purposes, they essentially don’t care one way or the other – whether bike lanes are expanded or not.
The net results are as follows:
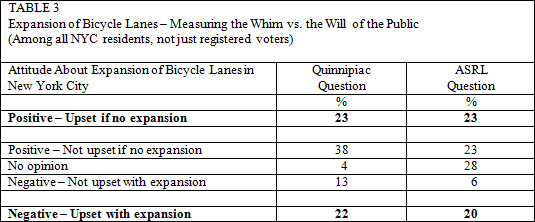 |
Note the similarity in results using the Quinnipiac question and the ASRL question – once the intensity questions have been asked. A little more than a fifth (23%) of New Yorkers are positive about the expansion of bike lanes and say they would be upset if there were no expansion. Another fifth (22% or 20%) express negative opinions about the bike lanes and are upset that there is an expansion
The rest of New Yorkers aren’t upset that there is an expansion, but they also wouldn’t be upset if there were no expansion. Essentially, they don’t care one way or the other.
Marist Poll
After the ASRL poll had already begun, Marist published the results of its July poll, showing “Two Thirds Favor NYC bike lanes.”
How did Marist get figures even higher than Quinnipiac? Two factors help explain the difference: 1) Marist’s results are based on all residents, not just registered voters (that accounts for one or two percentage points), and 2) Marist didn’t ask about the expansion of bike lanes, but about bike lanes in general: “In general, do you support or oppose bike lanes in New York City?” It clearly does not address the issue of expansion of bike lanes.
Marist’s subsequent question did address that issue: Only 27% wanted to “add more bike lanes,” while 23% wanted to see them reduced. Still, the headline out of Marist was the two-thirds support for bike lanes in general.
Like Quinnipiac, Marist asked a forced choice question about bike lanes and failed to measure intensity of opinion. And like Quinnipiac, Marist wildly overestimates the percentage of residents with a genuine opinion
ASRL Poll
Other major findings of the ASRL poll:
People who have heard “a lot” about the expansion of bike lanes oppose the expansion by a 12-point margin (35% oppose, 23% favor), with 42% indifferent. Residents who have heard only “some,” “not much,” or “nothing at all” tend to favor the expansion, by an average of about 8 percentage points (23% to 15%), with 62% indifferent.
New Yorkers who are most upset with the expansion are people who drive cars every day along streets and roads with the bicycle lanes. They represent about a fifth (19%) of city residents. They oppose the expansion by 37% to 22%, with the rest (41%) not upset one way or the other.
The strongest supporters of bicycle lanes, of course, are frequent bike riders. They represent about 7% of adults in the city – people who report riding in the bicycle lanes at least a few times a week or more. They support the expansion of lanes by 58% to 16% (with the rest indifferent).
Infrequent riders support the expansion of bicycle lanes by 33% to 16%, with just over half not caring one way or the other.
People who never ride bicycles are mostly unconcerned about the issue (61%), while the rest of the non-riders lean a bit more negatively (23%) than positively (16%).
The frequency of walking along streets with bicycle lanes shows no correlation with attitudes about the expansion of those lanes.
New Yorkers who are engaged in the issue (those who would be upset if their preferences were not to be adopted) are about evenly divided as to the future: About 39% would like to see more bicycle lanes, while 41% would like to see either fewer lanes (26%) or none at all (15%). Another 20% are satisfied with the current number.
One argument against bike lanes is the high potential for accidents. The poll finds that three quarters (77%) of New Yorkers have witnessed a dangerous situation in the city involving a bike at least once in the past year – such as the bicycle going the wrong way on a street, a bicycle riding on a sidewalk, or a bicycle coming close to striking a pedestrian, car or cyclist.
Almost a third (31%) have witnessed such a situation more than five times in the past year, and among opponents of bike lanes, that number rises to 46%.
Implications
Does it matter which view of the public that pollsters present? The view presented by Quinnipiac and Marist is of a public that is widely engaged with clear opinions. That’s simply unrealistic. Of all the problems and issues New Yorkers face on a daily basis, the notion that virtually all of them are immersed in the issue of bicycle lanes defies credulity.
Marist and Quinnipiac also suggest that a large majority of the public is firmly behind the city’s efforts to expand the bike lanes. But that “support” is largely an illusion created by biased poll questions, where respondents are pressured to come up with opinions, no matter how shallow they may hold them.
The view presented by the ASRL poll is far more realistic – a public that is mostly unengaged in the issue of bicycle lane expansion, but among people who are engaged, about an equal number intensely in favor and intensely opposed to the expansion policy.
The first view gives the impression that the policy of bike lane expansion is legitimate because a majority of residents are in favor. It allows supporters to deflect criticism of the policy overall, and the way it’s being implemented, by pointing to alleged widespread public support.
The second version points to a realistic view of where the public stands, but it also identifies where the points of contention are. Most policies are probably not supported by majorities of the public – the average citizen hasn’t the time or expertise to be engaged on all issues. Nor are most policies opposed by majorities, despite what the polls show. We are deluded about public support and opposition, because most media pollsters refuse to measure and take into account how intensely people feel about the issues.
The issue of expanding bike lanes is one that needs to be addressed by all parties concerned — as it is in New York City. But polls that manufacture consent should not be used to intrude into the process and detract from those who have legimitate concerns about whether, and how, the bike lane policy should be implemented.
The public, the government, the media — we all — need a realistic assessment of public opinion on the issues, not the kind of superficial poll-manufactured public opinion that is too often treated as the real deal.
*Art Science Research Laboratory, www.asrlab.org, is not-for-profit, co-founded with the late Harvard professor and scientist, Stephen Jay Gould, and his wife, sculptor, art historian and journalist, Rhonda Roland Shearer. It has a non-partisan journalism ethics program in which students and young journalists work with professional researchers to promote the media’s use of scientific methods and experts before publication. ASRL also publishes investigations of factual errors and ethical breaches by media outlets on www.iMediaEthics.org. Alexa ranks iMediaEthics.org among the Top 20 most visited news media watchdogs.
METHODOLOGY STATEMENT AND TOPLINE
How ASRL Survey Was Conducted
SurveyUSA interviewed 898 adults from the city of New York Thursday 08/04/11 through Monday 08/08/11. Of the interviews, 66% were completed using recorded-voice telephone calls to landline phones.The youngest-male method of respondent selection was used on these landline calls. 26% of interviews were completed by live operators who: hand-dialed cell phones; reached respondents determined to use a cell phone to receive calls; asked the research questions; and remained on the line until the cell-phone interview was completed. An additional 8% of interviews were completed by live operators, who hand-dialed cell phones but reached a respondent determined to use his/her cell phone as a supplementary not a primary phone. These 8% “cell supplementary” respondents are aggregated on the crosstabs as landline respondents. Random sample for both landline and cell phone respondents was purchased from SSI of Shelton CT. Responses were minimally weighted to U.S. Census targets for gender, age and race. Where necessary, questions and answer choices were rotated to prevent order bias, recency and latency effects. SurveyUSA assigns to each question within the instrument a theoretical margin of sampling error, but such error is useful only in theory, and though commonly cited in the presentation of research results, sampling error is only one of many types of error that may influence the outcome of an opinion research study. More practical concerns include the inability to contact some, the refusal of others to be interviewed and the inability of still others to speak the language. It is difficult to quantify non-sampling errors.
About SurveyUSA: SurveyUSA is a research innovator, with an unmatched 50-state track record for polling integrity and full disclosure. SurveyUSA has tracked 1,000 separate election contests for media clients and regularly conducts non-election research for commercial clients, academic institutions, governments and agencies. 1-800-786-8000, www.surveyusa.com.
 |
ASRL POLL TOPLINE
(Totals do not always equal 100% because of rounding.)
 |
Q.2 [ASKED OF HALF SAMPLE; N=433; MOE = +/- 5%.]
As you may know, there has been an expansion of bicycle lanes in New York City. Which comes closer to your point of view: One: This is a good thing, because it’s greener and healthier for people to ride their bicycle, OR Two: This is a bad thing because it leaves less room for cars which increases traffic? [Responses randomly rotated.]
All Registered Voters
61% 60% Good thing
35% 35% Bad thing
4% 5% No opinion
Q.3 [ASKED OF HALF SAMPLE; N=465; MOE=+/- 5%.]
As you may know, there has been an expansion of bicycle lanes in New York City. Do you favor or oppose the expansion of bicycle lanes? Or don’t you have an opinion either way?
46% Favor
26% Oppose
28% No opinion/not sure
Q.4 [ASKED OF RESPONDENTS WHO SAID EXPANSION IS A GOOD THING, OR WHO SAID THEY FAVORED THE EXPANSION; N=479; MOE=+/- 5%.]
If there were NOT an expansion of bicycle lanes, how upset would you be?
16% Very upset
26% Somewhat upset
31% Not too upset
24% Not upset at all
2% Not sure
Q.5 [ASKED OF RESPONDENTS WHO SAID EXPANSION IS A BAD THING, OR WHO SAID THEY OPPOSED THE EXPANSION; N=271; MOE=+/- 6%.]
How upset are you because of the expansion of bicycle lanes?
35% Very upset
33% Somewhat upset
19% Not too upset
11% Not upset at all
1% Not sure
COMBINED RESULTS OF Q.2 AND Q.3 WITH RESULTS OF Q.4 AND Q.5
Respondents who said they were “very” or “somewhat” upset were included as “upset.”
Respondents who said they were “not too” or “not at all” upset, or who said they had no opinion or were not sure, were all included as “not upset.”
 |
| caption here |
Q.6 [ASKED OF ALL; N=898; MOE = +/- 3%.]
How often do you personally ride a bicycle in a New York City bicycle lane?
71% Never
16% Occasionally
5% Few times a month
3% Few times a week
4% Almost every day
0% Not sure
Q.7 [ASKED OF ALL; N=898; MOE = +/- 3%.]
How often do you walk along a New York City street where there are bicycle lanes?
16% Never
28% Occasionally
15% Few times a month
18% Few times a week
22% Almost every day
1% Not sure
Q.8 [ASKED OF ALL; N=898; MOE = +/- 3%.]
How often do you drive along a New York City street with bicycle lanes?
31% Never
24% Occasionally
12% Few times a month
14% Few times a week
19% Almost every day
1% Not sure
Q.9 [ASKED OF ALL; N=898; MOE = +/- 3%.]
In the past year, how many times have you personally witnessed a dangerous situation in New York City involving a bicycle – such as the bicycle going the wrong way on a street, a bicycle riding on a sidewalk, or a bicycle coming close to striking a pedestrian, car or cyclist?
22% Never in the past year
26% Once or twice
20% 3 to 5 times
12% 6 to 10 times
19% More than 10 times
1% Not sure
Q. 10 [AMONG RESPONDENTS WHO SAID THEY ARE VERY OR SOMEWHAT UPSET BECAUSE OF THE EXPANSION OF BICYCLE LANES, OR WHO SAID THEY WOULD BE UPSET IF THERE WERE NO EXPANSION; N=406; MOE = +/- 5%.]
Ideally, what would you like to see in New York City?
15% No bicycle lanes at all
26% Fewer bicycle lanes than there are now
17% Exactly what there are now
39% More bicycle lanes than there are now
2% Not sure
See ASRL’s methodology here and David Moore’s Poll Skeptic Report here.
Go to David Moore’s Bike Lane Poll Methods Statement here .
This Poll is part of iMediaEthics’ PollCheck project to fact check media polls.
More iMediaEthics polls found here
UPDATE: 08/23/2011 6:51 PM EST : Made copy edits


Comments Terms and Conditions