(Credit: Secretlondon123 via Flickr)
In a recent New York Times op ed, Cliff Zukin, a long-time pollster and Rutgers University professor, addressed the question, What’s the Matter with Polling? I highly recommend the piece for anyone who pays even scant attention to polls, because it outlines the serious problems that pollsters have these days of obtaining valid population samples.
There are other serious problems with polling that Zukin does not mention, but more about that shortly. Back to the sampling issue.
The sine qua non of meaningful polls is that the samples of people who are interviewed must closely represent the larger population that is being studied. Typically, using well-designed sampling methods to select respondents, pollsters talk with only about 1,000 people nationally, and often only about 500 people in statewide contests. From those small samples, we generalize to what the larger population is thinking.
But, as Zukin points out, obtaining representative samples is becoming more and more problematic. The sampling designs are still scientifically valid, but most people simply don’t want to talk to pollsters. It used to be that the vast majority of people would participate in polls if asked. These days, however, the typical response rates from reputable pollsters is lower than 10 percent, with robo-polls reaching perhaps only 1 percent of the intended sample.
The net consequence is that we can no longer have statistical confidence that the samples represent the larger population. How different are the 90+ percent of people we want to interview from the small percentage who are willing to participate? Zukin’s point is, we just don’t know.
Pollsters have been lucky in past years, because it appears that despite low response rates, the small fraction of people who were willing to participate in polls did, more or less closely, represent the people who actually voted. However, the past two years have produced some election results that were clearly not predicted by the pollsters: the Republican wave in the 2014 U.S. mid-term elections, and the better-than-expected performances of the Conservatives in the United Kingdom and Prime Minister Benjamin Netanyahu in Israel.
Prognosis for the future is hardly sanguine. Zukin concludes, “In short, polls and pollsters are going to be less reliable. We may not even know when we’re off base. What this means for 2016 is anybody’s guess.”
More Than A Sampling Problem
Even before the problem with sampling became evident, however, pre-election polls provided unreliable measures. While the presidential election predictions were on target for most of the major polls (their final figures coming close to actual election results), the stories they told about the dynamics of the election were quite different.
While we don’t have any objective standards during a campaign to know what the actual race looked like, the fact that the polls vary widely from each other means they cannot all be right. Some have to be wrong. And we have no idea which, if any, provide an accurate picture of how the race unfolds.
One of the clearest examples is the 2008 election. I choose that election, because eight polls all came within two percentage points of predicting Obama’s popular vote margin. (By 2012, several polls had sampling problems, most notably Gallup, but not in 2008 and before).
Since they all came so close to the actual results, it’s obvious that the pollsters were able to obtain samples of voters that accurately represented the larger voting population.
Nevertheless, during October, the month running up to the election, the polls presented quite different pictures of Obama’s lead.
Among the most dramatically different stories told by these polls are the following:
- CBS (black line) reported that Obama began the month with a 3-point lead, surged to a 14-point lead the next week, and then lost ground each succeeding week until the election.
- By contrast, Pew (pink line) found Obama with a 6-point lead the second week of the month (8 points lower than CBS), which surged to 14 and then 15 points over the next two weeks, only to drop like a lead balloon a couple of days later in its final pre-election poll.
- Contrasting with these two polls is Rasmussen (olive line), which reported Obama’s lead as essentially constant the whole month, varying only between 5 and 6 points, while IBD/TIPP (orange dotted line) also showed a fairly static race – with Obama’s lead at a steady 4 points for three weeks, before jumping to a 7-point lead right before the election.
- GWU’s trend (blue line) was completely different from the four just mentioned, finding Obama leading by 4 points the first week, jumping to 8 points the second week, sinking to just 2 points in the third week, then sliding back up to a 5-point lead just before the election.
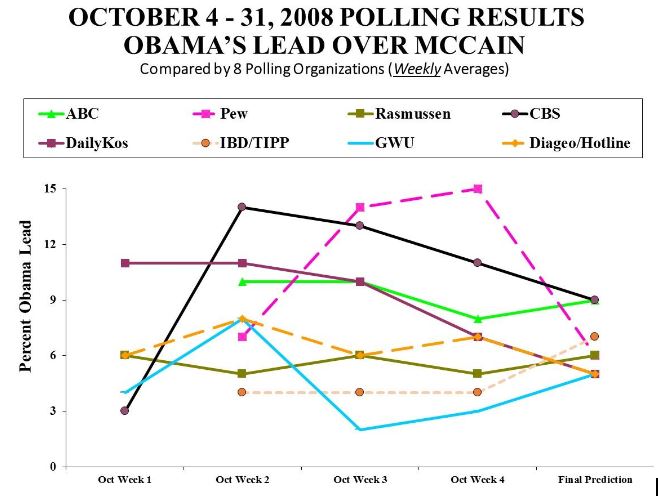
It’s pretty clear from the chart that the “polls” – as accurate as they were in their final predictions – did not provide a consistent picture of what happened during the last month before the vote.
Similar chaotic patterns were found in 2004 and 2000, when the final pre-election polls were right on target, but the polls during the campaign produced largely conflicting results.
Pew’s Andrew Kohut noted after the 2000 election, “Being accurate in the end did not improve the image of polling in a campaign that was tarnished by too many horse-race polls that confused rather than clarified public opinion.”*
The confusion continues election after election. And it’s more than a sampling problem.
Public Policy Polling
If polls appear to be “confusing” during an election campaign, when the leads for candidates vary by as much as 15 points from one poll to another, consider polls that ask people questions about public policy issues. The confusion is several magnitudes greater.
Confusion is not always evident, because it’s infrequent that two polling organizations will ask about the same issue at approximately the same time. But when they do, we can often see that there is indeed something the matter with polls.
Consider two polls in February that asked about Israeli Prime Minister Benjamin Netanyahu’s visit to the U.S., where he addressed the Congress. One poll found a net 18-point margin in favor of the visit, while the other found a net 30-point margin against it – a difference of 48 points.
In May/June of 2014, two polls reported on public attitudes about the core curriculum. One found support by a margin of 27 points, the other net opposition by 27 points – a difference of 54 points.
On this site, I’ve discussed several other examples when polls have produced substantially conflicting results:
- NSA Snooping (Why_3_polls_on_NSA Snooping Produce Wildly Contradictory Results, and How Pollsters Explain Contradictory Polls on NSA Snooping)
- Immigration (Legal Residency or Pathway to Citizenship: Three Polls, Three Answers)
- The Sequester (Two Misleading Polls on the Sequester)
- Banning Semi-Automatic Weapons (Banning Semi-Automatic Weapons: Why Do Three Polls Report Conflicting Responses?)
- Rescuing the Auto Industry (Why Gallup & Pew Poll Results Conflict on Auto Industry)
- Troop Withdrawal From Afghanistan (Polls On U.S. Troop Withdrawal From Afghanistan: “Yes! Yes! Maybe! Maybe! Hell No!”)
- Bush-Era Tax Cuts (Bush-Era Tax Cuts & Public Opinion: Those Crazy Media Polls Are At It Again!) –
So, what’s really the matter with polls?
A lot more than what Cliff Zukin told us.
*See discussion in David W. Moore, The Opinion Makers: An Insider Exposes the Truth Behind the Polls (Beacon Press, 2009), pp. 76-80.


Comments Terms and Conditions