
(Credit: Flickr/DonkeyHotey)
By now, only a first-time visitor to planet Earth might wonder why everyone is angry with pollsters.
Prior to the election, Natalie Jackson, Senior Polling Editor at HuffPollster, wrote that “A Donald Trump win would signal the biggest poll failure ever.”
Then she added in the past tense, as though she had some crystal ball or the disaster had already occurred (her piece was published two and a half weeks before the election): “Not even ‘Dewey beats Truman’ was this big.”
Well, yes and no.
In 1948, it was the national polling that predicted Gov. Thomas E. Dewey of New York to beat President Harry S Truman. Besides, the Republicans had swept the Democrats out of office in the 1946 congressional mid-terms, so Dewey’s victory was seen as a natural conclusion to a political shift in the country. Truman’s surprise victory was indeed a big polling failure.
As it turns out in 2016, however, the national polling figures were not all that bad. They predicted Hillary Clinton to win by about four percentage points. In fact, it appears she may win the popular vote by close to two percentage points.
Still, as Jackson foresaw, Trump’s victory signals a near earth-shattering polling failure, with implications for countries all over the world. There will be months, if not years, of analyzing and agonizing over the reasons.
But it’s important to keep in mind that it was not the national polling but the state polling that was so atrocious. It misled all the major poll aggregators (like the New York Times Upshot, Nate Silver’s fivethirty-eight.com, and HuffPollster) into believing that Clinton could win in enough states to garner 270 electoral votes.
Apparently, the state polls also fooled the Trump data team, which believed their candidate had only a one in five chance of winning, even lower than Nate Silver’s estimate of 30 percent. Other poll aggregators had Clinton’s chances ranging from 83 percent to virtually 100 percent. (See here for a review of the predictions by the major aggregators.)
Exit Polls Also Predicted Clinton To Win: Based on National and State Polling
Most people don’t know much about the exit polls, except that the networks use them to help project election results during Election Night. Sponsored by a consortium of the five major networks (ABC, CBS, CNN, Fox, NBC) and the Associated Press, the exit poll operation – called the National Election Pool (NEP) – conducts interviews with voters on Election Day throughout the country as they emerge from their voting areas.
The results are initially combined with pre-election poll results, to see if a candidate leads by a large enough margin that the NEP can reliably project the winner. If the race is too close to call, the exit polling data will be combined with actual vote counts over the evening, until enough votes have been counted to make it safe to project the winner.
The horserace figures obtained by the early exit polls (before they are combined with actual vote count) are not routinely released for public consumption. However, the networks do provide comparisons of horserace figures by selected demographics, thus allowing anyone with a calculator to figure out the overall horserace numbers.
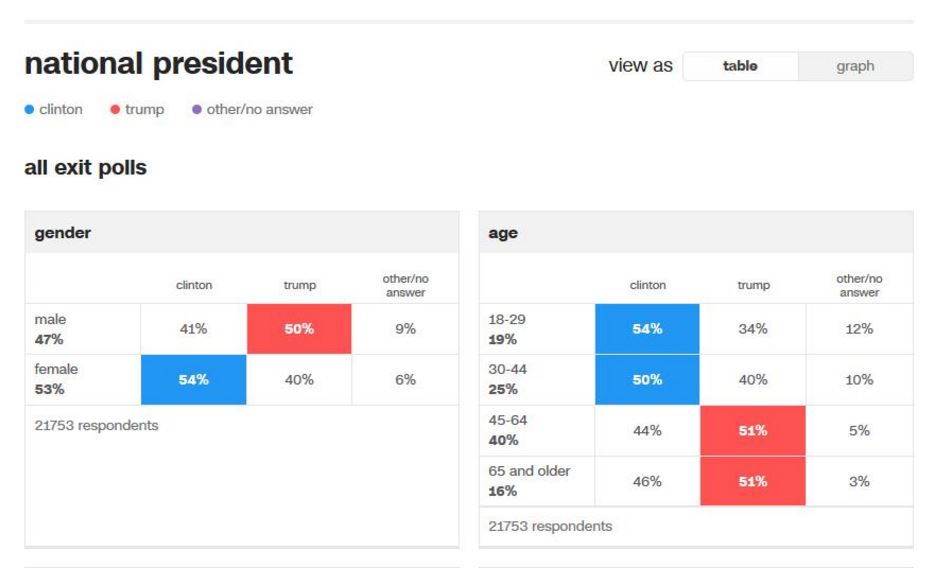
For example, in the graph below (digitally captured on TV by Jonathan D. Simon), as of 6:05 PM PST on Election Day, the national exit poll showed Clinton leading Trump among females 54% to 40%, while Trump led among males, 50% to 41%. The actual composition of the two groups was: male, 47%; females, 53%. One can average the horserace numbers, weighted by the composition figures, to show that overall, Clinton led Trump nationally by 47.9% to 44.7% — a 3.2 percentage point lead.
Simon also captured the early exit poll results for 28 states where NEP was trying to project winners. (The other states were considered so red or blue already, there was little interest by the networks in spending the money to conduct exit polls there.) He compiled the results into a table. For purposes of economy, I am showing just the results for five of the states.
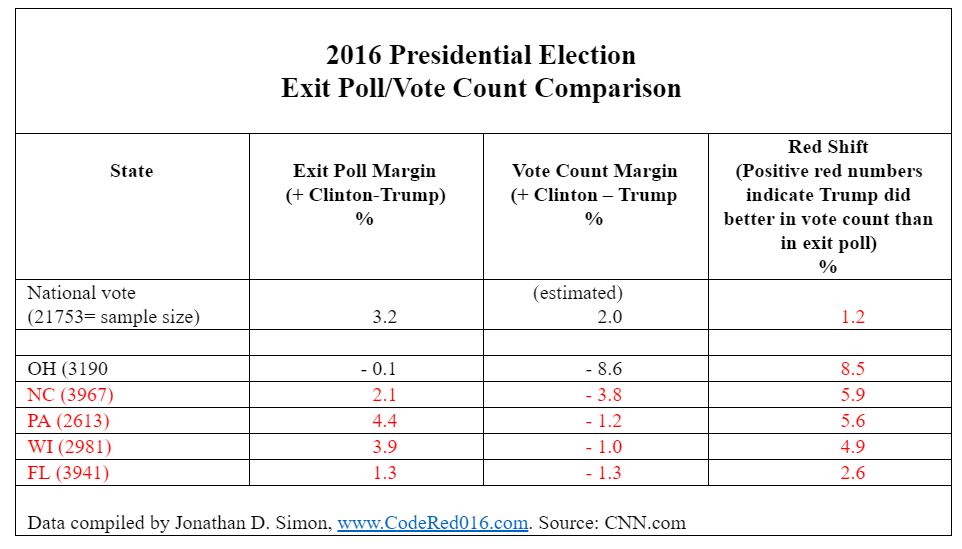
As shown in the table, the exit poll had Clinton leading by 3.2 points nationally, though the vote count suggests she may win by 2.0 points. That discrepancy (1.2 points) is minimal, but nevertheless illustrates what Simon calls the “red shift” — going from a bigger Clinton margin in the exit poll to a smaller margin in the vote count.
In Ohio, the exit poll showed basically a tie (Trump up by 0.1 percentage point), but Trump won the state by a significantly large 8.6-point margin, an increase of 8.5 points.
The crucial differences are found in the next four states, which is why they are highlighted in red. In each one, the exit poll in that state showed Clinton winning, while the vote count has her losing.
In North Carolina, for example, the exit poll showed her with a 2.1-point win, while the vote count had her losing by 3.8 points. In Pennsylvania, she went from a 4.4-point lead to a 1.2-point loss. And in Wisconsin, her 3.9-point margin in the exit poll was canceled by a 1.0-point deficit in the vote count.
The sample sizes for the battleground states are all quite large, so the discrepancies (the “red shifts”) for North Carolina, Pennsylvania, and Wisconsin are all statistically significant.
The red shift for Florida is smaller and is not significant at the same level of confidence as the other red shifts, though it is part of a larger pattern that suggests something amiss between the exit poll results and the vote count.
Had Clinton won the three states of Wisconsin, Pennsylvania and North Carolina, as the exit polls (and pre-election polls) suggested, she would have won with 277 electoral votes. And much of the outrage at the polling industry (as well as at Clinton and her campaign) would have been obviated.
Exit Polls and the U.S. Senate Races
Simon performed the same analysis on the exit polls for the 20 U.S. Senate races surveyed by NEP. Again, for purposes of economy, I present the results for just a few states.
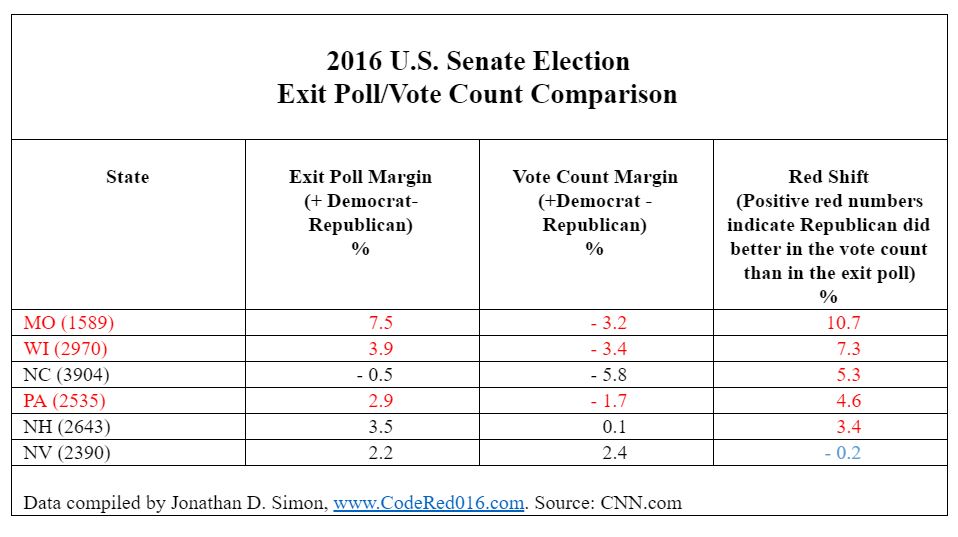
Note that in Missouri, the Democratic candidate, Jason Kander, lost to GOP Senator Roy Blunt in the vote count by 3.2 points, despite the exit poll showing Kander the winner by 7.5 points, a 10.7-point red shift.
Similar, though smaller shifts, occurred in Wisconsin and Pennsylvania, which reversed the winner from a Democrat to a Republican.
The other three races shown – in North Carolina, New Hampshire, and Nevada – all had close contests, with only Nevada showing a very small blue shift – where the GOP candidate did slightly better in the vote count than in the poll.
The red shifts in the four top-listed states are all statistically significant, while those in New Hampshire and Nevada are not.
Had the Democratic candidates in Missouri, Wisconsin and Pennsylvania all won, as the exit polls suggested, the Democrats would have won majority control of the U.S. Senate with 51 senators.
Possible Reasons for Discrepancies Between Exit Polls and Vote Count
Did the exit polls differ significantly from the vote count? Yes. Beyond a reasonable doubt.
If both the exit polls and the vote count were essentially correct, we would nevertheless expect there to be some discrepancies – but only small ones, which would sometimes favor one candidate, sometimes the other.
The evidence shows, however, that many of the discrepancies were not small nor randomly distributed between the two parties. Of the 28 state contests surveyed by NEP, 24 showed red shifts favoring Trump, 4 showed blue shifts favoring Clinton.
The probability of such a lopsided distribution is only one in 13,110. Stated another way, there is better than a 99.98 percent probability that such a distribution would not happen if both the exit polls and the vote counts were roughly the same.
If, instead of looking at all the states, we examine only those where the shift in either direction is statistically significant, we would find 12 states (Utah, Missouri, Ohio, South Carolina, Wisconsin, Colorado, Iowa, Kentucky, Oregon, North Carolina, Washington, and Pennsylvania) with significant red shifts, but no states with significant blue shifts.
The probability of 12 significant red shifts and zero significant blue shifts is one in 4,096, less than half of one percentage point. There is better than a 99.5% chance that such an outcome would not occur if both the vote count and exit polls were in sync.
Of the 20 Senate races, 11 had significant red shifts, none had significant blue shifts, virtually the same lopsided and unlikely pattern as the presidential results.
Thus, it is more than reasonable to conclude that the exit polls and the vote count provided significantly different pictures of the election outcome.
Which to Believe: Exit Polls or Vote Count?
Given the red shifts described above, what’s the conclusion? There are only two possible options: The exit polls were severely flawed. Or the vote count was systematically incorrect. In the latter case, that would mean intentional manipulation, or election fraud.
The reassuring choice is that the exit polls were wrong and the vote count was right. That is the position that Joe Lenski (current director of the NEP effort) and the late Warren Mitofsky, the inventor of exit polls, expressed when confronted with similar red shift discrepancies in 2000 and 2004.
I was with them on Election Night both years, but 2004 was perhaps the most dramatic. When I arrived at the NEP headquarters at Edison Research in Somerville, N.J., in late afternoon of Election Day, Mitofsky greeted me with the statement that John Kerry had won the election. He was convinced of that outcome based on the national exit poll that had been in process the whole day, which showed a clear victory for the Massachusetts Senator. But the vote count over the evening did not agree. Mitofsky faulted the exit polls.
Steve Freeman, an election integrity activist, analyzed the 2004 exit poll data and arrived at some troubling conclusions about the integrity of the voting process. Since then, he and Jonathon Simon and many other election integrity activists have argued that the persistent red shift bias is evidence that our method of counting votes is not safe.
In his recent article, “Something Stinks When Exit Polls and Official Counts Don’t Match,” Steven Rosenfeld confirms that “election integrity activists say the exit poll discrepancy underscores the need for a far more transparent and accountable process.”
Rosenfeld reports on an interview with Simon, who emphasizes that the voting machines and process for counting ballots are vulnerable to manipulation and that the exit polls provide – not necessarily proof of election fraud – but a clear and dangerous warning sign that it could be occurring. “Neither system,” he says, “is self-validating. Neither system can be trusted.”
In August of this year, Richard Clarke, a well-known international cybersecurity expert who worked in the administrations of Presidents Bill Clinton, George W. Bush, and Barack Obama, wrote on ABC news, “Yes, It’s Possible to Hack the Election”:
“These experiences [working with the White House] confirm my belief that if sophisticated hackers want to get into any computer or electronic device, even one that is not connected to the internet, they can do so.
“If someone makes the charge after this election that the results were altered by hackers, our country has almost no way of credibly refuting that claim. Thus, American voters will have no way to know if they can trust the results of the election… [emphasis added]
“In any close election, because we have not done the simple things that could protect the integrity of our democratic process, there will be room for doubt.”
So, what does it mean that the exit polls – like the pre-election polls – predicted a Clinton victory, while the vote count came to the opposite conclusion?
One meaning seems obvious: We cannot be confident that the declared winner of the Electoral Vote is the real winner.
As Clarke notes, there is room for doubt.
Considerable doubt.


Comments Terms and Conditions