(Credit: Washington Post, screenshot)
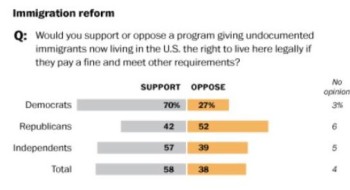
According to the latest ABC/Washington Post poll on immigration reform, a solid majority of Americans continue to support a “path to legal status for undocumented immigrants,” 58% in favor, 38% opposed.
While that seems to suggest a committed public in favor of reform, with negative electoral consequences for political representatives who oppose such reform, two intensity measures included in the poll tell a very different story.
One measure asks respondents if they support/oppose the measure “strongly or somewhat,” while the other asks if the respondents could vote for a Congressional candidate who opposed the respondent’s point of view.
As it turns out, the opponents are much more committed to their opinions than are supporters. The net result is that once intensity is measured, the public appears to be about evenly divided, with a large plurality, or even majority, of Americans not firmly committed to either side of the issue.

The graph shows three results, all based on the poll. The first represents the basic numbers reported by ABC and the Washington Post, suggesting a large majority in favor of reform. In this measure, respondents were asked the poll’s standard question:
“Would you support or oppose a program giving undocumented immigrants now living in the United States the right to live here legally if they pay a fine and meet other requirements?”
Note that this form of the question does not provide any measure of intensity, nor does it offer an explicit “no opinion” option. Just 4% volunteered they didn’t have an opinion.
The second set of bars reflects the fact that based on a follow-up question, 34% of the poll’s respondents said they “strongly” favored the proposal, while 29% said they “strongly” opposed the proposal. The rest did not have strong views either way.
Finally, the last sent of bars shows that 25% of the poll’s respondents said they favored the proposal and they could not “support a candidate for Congress who voted against a path to legal status for undocumented immigrants,” while 23% said they opposed the proposal and could not “support a candidate for Congress who voted in favor of a path to legal status for undocumented immigrants.” The rest either had no opinion, or said their views wouldn’t affect their support for their Congressional representative.
Which is the most realistic picture of public opinion?
The first set of bars, I argue, represents what might be called the “whim” of the public, the top-of-mind responses that respondents come up with at a moment’s notice, but could easily change.
The next two bars represent two different ways of getting at “meaningful” public opinion – the “will” of the public – opinions that the people themselves either feel strongly about or want their elected representatives to support.
It’s not clear which of several possible measures can best represent the “will” of the public, though it does seem clear that the first set of bars is highly misleading. Yet, those are the figures that both ABC and the Post highlighted.
The third set has a higher bar for meaningful opinion – the willingness of the respondent to vote against a Congressional representative who takes the opposite view, even if they agree with the representative on most other issues.
The middle set provides results that are similar to what the iMediaEthics poll reported earlier this month, when it measured intensity by asking if people would be “upset” if their own view did not prevail and compared results with a previous ABC/Post poll and an NBC/Wall Street Journal poll – which measured intensity by asking if people felt “strongly” about their views. All suggest a rather evenly divided public, with a large proportion uncertain.
So, why do the least meaningful results, based on the forced-choice questions, always get the highest billing? Why, indeed!