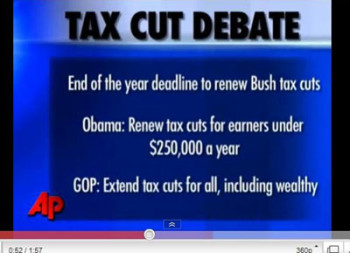
See the above screenshot detail from an Associated Press video about the tax cut debate. (Credit: YouTube, AP)
Based on its most recent poll of the American public, the Associated Press just announced that “Almost half the country opposes tax increases for the richest Americans…suggesting that congressional Democrats are taking some risk by backing President Barack Obama’s plan to boost levies on the wealthy.”
What the AP story didn’t tell us is that several other media polls come to quite different conclusions, nor that AP’s new results are virtually identical to what it reported a month earlier. For some reason, in this current article, AP reports only its poll results as “news,” ignoring all the other poll results that are contradictory.
 Moreover, all the polls – every last one of them – incorrectly phrase the question about the tax cuts, making it appear as though the choice is between tax cuts for everyone and tax cuts just for the people who are not rich. In fact, however, the issue facing the Congress is tax cuts for everyone on the first $250,000 of income only, or tax cuts also on incomes of more than $250,000.
This distinction is not trivial. Virtually all of the questions implicitly raise an issue of fairness – is it “fair” that rich people not be given the same tax cuts that poorer people are given? For example, the question wording of the AP poll is as follows:
The tax cuts that were passed in 2001 will expire this year if they are not continued. Which of the following best describes what you think Congress should do about the tax cuts?
1 Allow the tax cuts to expire for everyone
2 Allow the tax cuts for people earning more than $250,000 a year to expire, but continue them for other people, or
3 Continue the tax cuts for everyone (emphasis added)
The second option implies that people earning more than $250,000 a year would not get any tax cuts, when in fact they would – on the first $250,000 of their income, just like everyone else. Because that option implies the “rich” would not get any tax cuts, the last option – continue tax cuts for everyone – appears to be the fairest.
Of course, the fairness standard can be trumped by other considerations, with many people thinking it is, in fact, fair that the rich not get any tax cuts. Still, it’s quite likely the percentages opting for tax cuts only on incomes of less than $250,000 would be different if the questions were worded more accurately.
Despite the bias in all of the polls, the many different poll results (see Pollingreport.com) show how divergent “opinion” is depending on how the question is framed. In the following graph are the percentages of Americans found by each poll who oppose extending the Bush-era tax cuts for “rich” Americans (in some polls referred to as “wealthy” and in other polls as people who earn more than $250,000 per year), but want to continue the tax cuts for the rest of Americans.
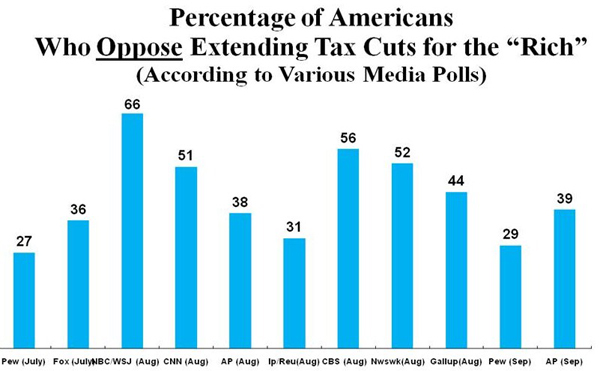 Polls asking if Americans are against extending tax cuts for the “rich” have produced varied responses depending on who took the polls. |
Note that AP and Pew both conducted two polls – Pew in July and September of this year, and AP in August and September – and each poll found essentially no change over the intervening weeks of their polls.
Thus, we can reasonably conclude that the differences among the polls are not caused by crazy Americans, opposing tax cuts for the “rich” by anywhere from 27 percent to 66 percent, depending on their passing mood! The conclusion, instead, is that these wildly fluctuating results are the consequence of how pollsters present the issue to their respondents.
As the AP news story suggests, there is also a portion of the public which supports extending tax cuts for the “rich,” though as pointed out earlier, in part that’s because of the biased question wording that all pollsters used. The poll results vary from 29 percent to 49 percent, as shown in the accompanying graph.
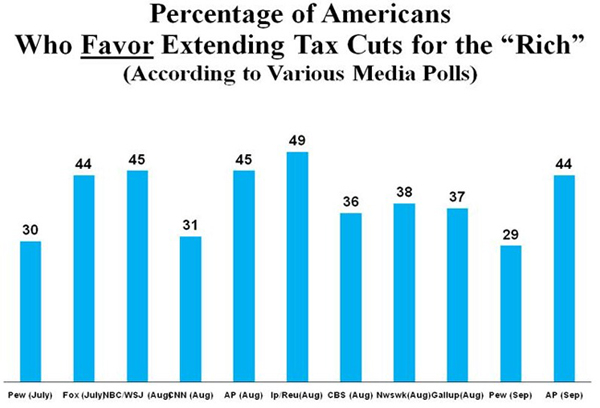 Do Americans favor extending tax cuts for the “rich”? According to the above graph, it depends on which poll you read. |
The key political question, however, is the difference in the percentage of Americans who oppose extending the tax cuts for the rich and the percentage who support extending them.
The AP story suggests that congressional Democrats would be taking a risk in supporting Obama’s plan to extend the tax cuts only on incomes of less than $250,000 a year. Consistent with this conclusion, the latest AP poll finds a net percentage of Americans in favor of extending tax cuts for the rich by 7 percentage points – with 37 percent opposed and 44 percent in favor. (See accompanying graph.)
As the accompanying graph also shows, other polls report quite different results – from a net opposition to extending tax cuts to the rich of 20 to 21 percentage points (reported by NBC/WSJ, CNN and CBS) to a net 18 points in favor (reported by Ipsos/Reuters).
| See the net percentage of how different media polls have reported American sentiment for tax cuts for the “rich.” |
So, what do we make of these differences?
The most obvious conclusion is that a significant percentage of Americans – perhaps even most – really don’t have much of a handle on the issue.
When polls can get such different results, all in a short time span, that indicates that pollsters essentially create their own “public opinion” by the way they word the questions.
The AP story that talked about the risks to Democrats of following the Obama plan, for example, is countered by the CBS story that says “Most Americans Want Tax Cuts for the Rich to Expire.”
It is perhaps noteworthy that not one poll mentioned the cost of extending the tax cuts. Both congressional Republicans and Democrats support extending the tax cuts on incomes under $250,000, so there has been virtually no discussion in the news media of the cost of such a policy. However, Democrats have raised the issue of how much it would cost to extend the tax cuts on incomes above $250,000, presenting a figure of $700 billion over a ten-year period. But none of the media polls discussed in this article asked their respondents whether they would support extending tax cuts on all levels of income – at such a cost. It’s easy to express support for a policy, when the costs are ignored.
There is some good news about these polls. With such divergent results, you should be able to find at least one poll that supports your point of view. Just don’t take its results too literally as a reflection of what Americans actually think.
 |
George F. Bishop is Professor of Political Science and Director of the Graduate Certificate Program in Public Opinion & Survey Research at the University of Cincinnati. His most recent book, The Illusion of Public Opinion: Fact and Artifact in American Public Opinion Polls (Rowman & Littlefield, 2005) was included in Choice Magazine’s list of outstanding academic titles for 2005 (January 2006 issue).
 |
David W. Moore is a Senior Fellow with the Carsey Institute at the University of New Hampshire. He is a former Vice President of the Gallup Organization and was a senior editor with the Gallup Poll for thirteen years. He is author of The Opinion Makers: An Insider Exposes the Truth Behind the Polls (Beacon, 2008; trade paperback edition, 2009). Publishers’ Weekly refers to it as a “succinct and damning critique…Keen and witty throughout.”
>