(Credit: Pixabay)
As we enter a new decade, it may be useful (or at least interesting) to reflect on the major changes in polling during the past decade.
The polling industry, especially that part of the industry that involves national polls conducted for news media consumption, is undergoing a major transition – from mostly telephone polls conducted using probability samples, to online polls with non-probability samples that are statistically adjusted to look like the larger population they are intended to represent. By the end of this decade, it is likely that few, if any, major media organizations will conduct the standard telephone poll when surveying the national population.
Polls in many state and local communities will be able to use samples based on voter registration lists, as they are now. Whether such polls a decade from now will be conducted solely by telephone, by some combination of cell phone and online communication, or even online only, is still uncertain.
In the meantime, looking back – here is my list of the top five developments in the past decade:
1. Increase in use of cell phone by pollsters In 2010, there were many pollsters who didn’t include cell phones in their sample designs, and yet, according to the Centers for Disease Control (CDC), in that year 22.9% of adults could be reached by cell phones only. That number could only increase, forcing pollsters to change their calling methods.
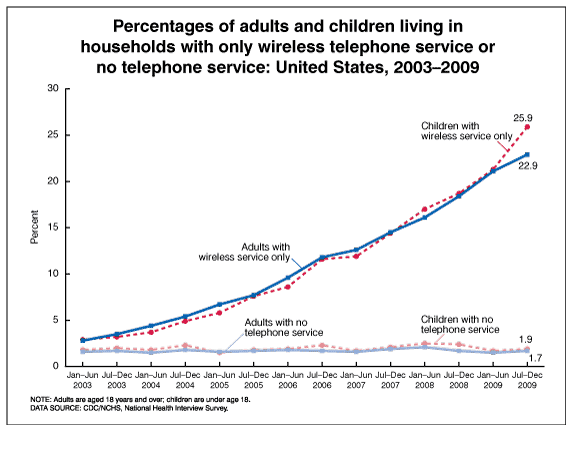
Indeed, nine years later, CDC reported that over half of American adults – 56.7% — lived in households with cell phone-only service – almost two and a half times as many as in 2010.
Pollsters adjusted accordingly. These days, pollsters who conduct polls by phone will generally have a majority of cell phone-only users in their samples.
The ABC/Washington Post poll, for example, conducted by Gary Langer of Langer Research, notes that it began interviewing respondents on cell phones for the first time in 2008, and now typically has 65% of its interviews completed by cell phones, just 35% by landline.
In December 2019, the NBC/Wall Street Journal poll’s sample included 55% of its respondents with cell phone only.
The trend will undoubtedly continue. Landline phones will soon be a thing of the past, like public pay phones and rotary dialing.
2. Increased cost of polling
Telephone polls are getting much more costly to conduct. The main reason is the declining number of people who are willing to answer calls from unfamiliar sources. That means it takes much longer for an interviewer to get hold of someone. My colleague, Andrew Smith at the University of New Hampshire, Director of the UNH Survey Center, tells me that five years ago, an average interviewer would be able to complete one 10-minute phone survey per hour. Now it’s one survey every two hours. That’s a doubling of interviewer costs in just five years. Five years earlier, the completion rate was closer to two surveys per hour.
As Pew Research has tracked, the telephone survey response rate has been declining for years.
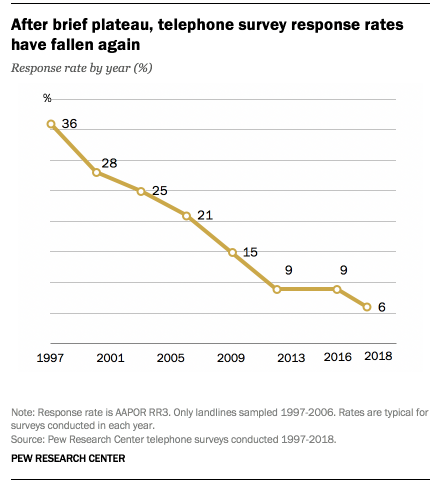
The 6% figure means that out of a sample of 100 potential respondents, Pew was able to reach only six. And Pew has a rigorous call-back process. Assuming a protocol of three call-backs before a number is dropped from the list, that means roughly 66 phone calls for every completed survey. For many pollsters, the response rate is even lower. But even for Pew, the response rate in 2009 was about two and a half times greater than in 2018.
All other factors being equal, that means labor costs have increased by roughly 250% over the past decade. For many pollsters, and clients who want poll results, the cost of telephone polls is becoming untenable.
3. Online polls replacing telephone polls
The decline in response rates and increased costs of telephone polling have led to two different developments to mitigate such costs: the rise and decline of robo-polling, and the rise of online polling.
By the early 2000s, several polling organizations had adopted robo-calling, or automated dialing. When the respondent comes on the line, a recorded voice will ask questions and direct the respondent to answer by pressing buttons on the phone. That process is referred to as interactive voice response (IVR).
Robo-polling significantly cut costs, by not having to rely on live interviewers. Typically, robo-polls do not include cell phones, because federal law prohibits automated dialing when calling cell phones. But, as cell phone-only households increased over the past decade, robo-polling that did not include cell phones became more suspect. As a consequence, most IVR pollsters began to include cell phones in their samples. They needed live interviewers to make such calls – thus increasing their costs.
The second development, one that has occurred mostly in the last part of the last decade, is the rise of online polling. My colleague, Andrew Smith of UNH, compiled this chart, which reveals how polls were conducted in the contested elections in battleground states in elections from 2006 to 2016. Note that this is only a subset of all polls we see in the news media, but the results give us an idea of the change in polling practices.
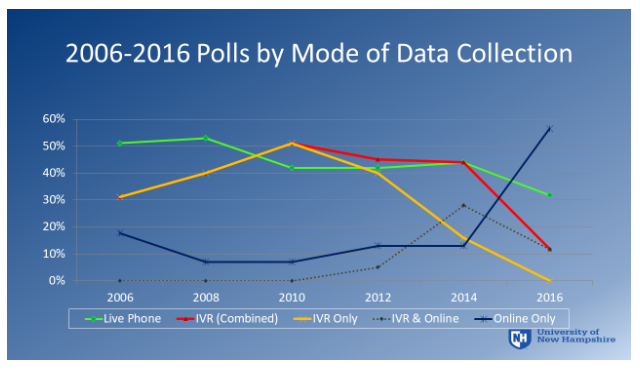
Note that 2010 was the high point of “pure” robo-polling (IVR) – landline only (the yellow line). The red line shows that IVR continued, but was supplemented by either live calling of cell phones, or by getting cell phone users who were online. By 2016, IVR-only had disappeared, though IVR supplemented with cell phones or with online respondents continued.
Another dramatic change is shown by the dark blue line which shows the increase in online polls. This change led Nate Cohn of the New York Times to make these observations:
“The transition away from live interview telephone polling is well underway, and online polls now make up the principal source of data on national public opinion.
“But the alternatives to traditional polling are not fully mature, and the absence of a clear set of standards for online polling research has opened the floodgates to unproven surveys of uncertain quality.
“Many of the new pollsters have become familiar enough that journalists and readers have started to cite them with confidence. It’s not yet clear they all deserve it.
“Of course, traditional live-interview telephone polls have been facing their own challenges. They have become very expensive, and they haven’t necessarily been faring that much better than many online surveys.”
Online polling is conducted in several different ways. The crux of the process is for the polling organization to persuade enough people to join that organization’s panel of respondents. Organizations provide different types of incentives to potential respondents, involving money or goods or something of value. In return, the respondent agrees to participate in a certain number of polls every month or year.
Some polling organizations will use a modified probability design in selecting respondents, others just advertise and accept people who volunteer. The panels are not necessarily representative of the adult population as a whole, but the pollster will weight the sample so that it has the same demographics as the population that the sample is intended to represent. Other factors may also be used to statistically manipulate the results to look like the larger population.
The main advantage of such online panels is that it’s very cheap to poll the respondents. All surveys are filled out online, and the poll itself can be conducted in a very short period of time.
As Nate Cohn observed:
“…the advent of nearly universal internet access has inaugurated a new era of experimentation in public opinion research. The online firms, scorned a decade ago, have developed techniques to improve the representativeness of their samples. They have applied statistical methods to iron out whatever other issues remain.”
But then he goes on to note that results of online polls…
“suggest that applying traditional sampling and weighting techniques to nontraditional data — the way most online pollsters do — might not be enough to produce high-quality results. The online pollsters have, for the most part, put forward relatively little evidence to demonstrate the effectiveness of their approach.”
Still, the march to online polling continues, and it seems only a matter of time when the news media will abandon altogether the standard national telephone poll.
4. The rise and fall of Nate Silver’s 538 presidential projections
As the number of polls increased over the decades, it soon became clear that polls conducted on the same subject and in roughly the same time periods would nevertheless show marked differences. That was particularly obvious in election polling. The question was always – which polls should be believed? One solution was to assume that all the polls were basically sound, and that differences were simply inherent in the polling process. Thus, the best estimate was based not on a single poll, but the average of all polls.
In 2000, two “news junkies” founded RealClearPolitics, a website that took the poll averaging idea seriously. While the site includes news and commentary unrelated to polls, it is probably best known for aggregating poll results, typically by averaging the results of various polls taken around the same time. Similar aggregating websites soon followed.
Then, in 2008, Nate Silver established his website, FiveThirtyEight (often referred to solely by the numerals 538), the number of electoral votes for president. Silver’s approach was different from other aggregators. Instead of simply averaging polls, treating all polls as essentially equal in quality, he enhanced the data by weighting results according to each poll’s “historical track record, sample size, and recentness of the poll.” In his election models, he would also include voter demographics and past voting data, and he would compare results historically in that election community with results in surrounding communities. For state models, he would include how that state voted compared historically with voting in other states.
Silver was interested in more than aggregating poll results. Using probability theory, he wanted to make predictions of the winners. This was a new phenomenon. Most pollsters and aggregators would list the final percentages, and perhaps even mention the margin of error. But Silver used statistical theory to assign a probability to his predictions.
In 2008, Silver’s predictions of the presidential vote were “correct” in all but Indiana, and a congressional district in Nebraska.
In 2010, the beginning of the decade, he moved to the New York Times.
In 2012, Silver’s 538 model correctly predicted the presidential winner in all 50 states and the District of Columbia. He became the wunderkind, the genius of election projections.
In 2014, Silver moved from the New York Times to ESPN, where much of his work focuses on sports. But he did not abandon politics.
Then in 2016, Silver’s aura of invincibility took a hit. He vastly underestimated Donald Trump’s chances of winning the Republican nomination, and admitted his mistakes. Silver also underestimated Bernie Sanders’ appeal, suggesting Sanders “could win Iowa and New Hampshire then lose everywhere else.” Sanders eventually won 23 states during the primary season.
The big polling disaster of 2016, however, was his prediction of the general election. Silver’s model gave Clinton better than a two-to-one chance of winning – 71.4 chance that Clinton would win the electoral college, with 302.2 electoral votes, while Trump would get just 235.0 electoral votes. The numbers were almost reversed: Trump won states with 306 electoral votes, Clinton 232. (The actual number of electoral votes cast was 304 for Trump, 227 for Clinton. The discrepancy was caused by two faithless electors defecting from Trump and five defecting from Clinton.)
Silver’s state-by-state projections in five of the battleground states were also woefully off the mark. According to Silver, Clinton’s probability of winning Wisconsin was 83.5%; Michigan, 78.9%; Pennsylvania, 77.0%; North Carolina, 55.5%; Florida, 55.1%. She lost in all those states.
Using those probabilities, Clinton had a 99.84% chance of winning at least one of those five states. She won none.
Silver might justifiably argue that the probabilities in each state were not independent of one another, so the chance of her winning at least one state was maybe lower than what I’ve presented. How much lower is difficult to say, because it’s not clear how dependent the state calculations were on each other.
Nevertheless, the figures show how “wrong” people were to expect a Clinton victory based on Silver’s models.
But was Silver actually wrong? The problem with assigning blame is that his projection was a probability assessment. According to his projection, Trump had a 28.6% chance of winning the electoral vote. Sometimes, the unexpected happens. So, we can’t say that Silver’s model was “wrong.” The only way we can really assess such probabilities is to compare results over a very large number of cases.
His models are better suited for predicting the probability that, say, a basketball player will miss a free throw, because typically basketball players have a large number of free throws for comparison. Such is not the case for presidential elections. Silver has calculated probabilities of presidential outcomes in only three elections, though he is currently preparing for this fourth.
What we can say is that Silver estimated the chances of a Clinton loss to be small, but not zero. However, the chances that Clinton would lose all those swing states was extremely small (less than two tenths of one percent), pretty close to zero.
Whatever the probabilities said, the public was highly misled. Some critics pointed to weaknesses in Clinton’s campaign, because she did not spend enough time in Wisconsin and Michigan. But according to Silver’s probability model, she had about an 80% chance of winning in each state. Why spend resources in such “sure” states, when other states are more competitive? Clearly, relying on Silver’s models was not helpful to the Clinton campaign.
In the future, political candidates – and presumably the media and public as well – will not be so ready to accept Silver’s probability assessments. His election models, after all, rely on data from polls. However enhanced, if the polls are wrong, the models almost certainly will be as well. It’s the old GIGO formula – garbage in, garbage out.
It’s a lesson that we all have to relearn from time to time.
5. Pollsters distrusting their own polls
As polling has become more difficult, because of the diminishing response rates and increased costs, pollsters have become more wary of their own poll results. Here are some examples:
- As noted on this website in October 2016, two giants in the public policy polling industry – Pew Research and Gallup – announced that they would no longer conduct any pre-election polls. Instead, they argued, they would rather focus on the “attitudes and dynamics” that shape the election. The reality: They don’t want their polls tested against actual election results. Because of their respective reputations, they can release results about other matters, and the news media will pick them up. Thus, the two organizations don’t have to suffer the ignominy of maybe being wrong when push comes to shove – when polling results are checked against the election – and they can still get their results treated respectfully by the news media.
- An alternative to stopping all polling is for a news outlet to conduct/sponsor polls during the campaign, but refrain from conducting polls during the last two weeks of the election. This allows the news organization to write news stories based on their own polls, but avoid having their polls being compared with actual results. Poll aggregators will use only those polls closest to the election (typically about two weeks or less) to make the final projection. In the 2016 presidential contest, RealClearPolitics included ten final media polls, though many more news outlets conducted polls during the campaign and abstained from polling in the final two weeks. Such “fraidy cats” included Pew Research (before it announced it would do no more pre-election polling), USA Today, the Associated Press, CNN, and Quinnipiac. In the 2016 New Hampshire primary, RealClearPolitics included six final media polls, though – again – many more news outlets conducted polls during the campaign. The “fraidy cats” for that primary included Fox, Morning Consult, CBS, NBC/WSJ, Bloomberg, the Boston Globe and the Boston Herald. Those examples are from well-known media organizations. Many others, not so well-known, engaged in the same strategy.
- In 2008, I noted a phenomenon which I termed the “convergence mystery.” Essentially, polls showed much higher variability during the campaign than when the final polls were released. Since then, the term “herding” has come to represent that phenomenon – the tendency of pollsters to shade their final polls based on what other polls show. As the American Association for Public Opinion Research (AAPOR) describes it: “‘Herding’ specifically refers to the possibility that pollsters use existing poll results to help adjust the presentation of their own poll results. ‘Herding’ strategies can range from making statistical adjustments to ensure that the released results appear similar to existing polls to deciding whether or not to release the poll depending on how the results compare to existing polls.” For examples, see awards #4 and #3 of the 12th Annual Top Ten Dubious Polling Awards. One pollster refused to release his results because they were not similar to other polls, though his results turned out to be more accurate than anyone else’s. And sixteen pollsters all got the election wrong, apparently because of herding, according to a Nobel Laureate, who concluded, “Based on the number of people interviewed, the odds of those 16 polls coming in with the same, small spread of answers is greater than 100,000 to 1. In other words, the polls have been manipulated, probably unintentionally, to give the same answers as each other. The mathematics does not lie…”
It is definitely becoming more difficult to poll the public, given the many ways people can block calls and refuse to participate. But the tactics described above do not give us confidence that the polling industry is as transparent as pollsters should be in addressing these problems.
Based on these five trends, the average citizen might well ask: Can we still trust polls? Pew Research asked that very question, and responded by saying, “Our new video explains why well-designed polls can be trusted.” It’s a bit ironic, though perhaps understandable, that the organization that is too afraid of conducting election polls nevertheless reassures us the polls are accurate.
But that view is also supported by Nate Silver, who assures us that “American election polls are about as accurate as they’ve ever been.”
How accurate has that been? Silver says, “As a simple rule of thumb, we’ve found polls ‘call’ the right winner about 80 percent of the time, meaning they fail to do so the other 20 percent of the time…The rate of upsets hasn’t changed much over time.”
We just don’t know which elections will fall into that 20 percent.
One last point: Just because “the polls” in the aggregate can come close to election results, it doesn’t mean that we can trust any individual poll on specific public policy issues. Indeed, the whole point of aggregating polls is that we can’t trust the results of any one poll, and that only the average will give us a relatively unbiased picture.
When it comes to public policy polls, however, typically there may be only one or two polls, or a handful, and not all asking exactly the same questions. Trusting the results of any one of them is, at best, a dubious proposition. That has always been true. But given the trends of the past decade – with pollsters moving from probability based polling to online modeling – the need for skepticism is even greater now than it has been.