
(Credit: FutUndBeidl/Flickr)
It seems that all political eyes these days are focused on the generic ballot, which should provide the inquiring – and impatient – mind an inkling of what the 2018 mid-term elections might bring.
The poll question for the generic ballot asks voters who they will support for the House of Representatives in the November election – a Republican or Democrat. It’s called “generic,” because no specific candidates’ names are mentioned, only the party that voters will choose.
It’s important to note that the results present a national preference, how many voters overall prefer one party or the other. Yet, in the actual election, there are 435 congressional districts, and the national vote doesn’t necessarily predict how many of those districts each party will win.
In fact, theoretically, if the 435 districts were politically homogeneous, one party could win every district with 51% of the vote, and win 100% of the House seats. In actual practice, however, the national vote preference and the distribution of House seats show some predictable patterns.
Keeping in mind that polls three and a half months before the election are not especially predictive, we can still look at the numbers in an historical context to see what they would mean if they continue as they are, or what they would have to be for a change in which party wins a majority of seats.
Three aggregators of polls reporting on the generic ballot – HuffingtonPost, RealClearPolitics, and FiveThirtyEight – all show similar results: As of mid-July, Democrats are ahead of Republicans by about eight percentage points.
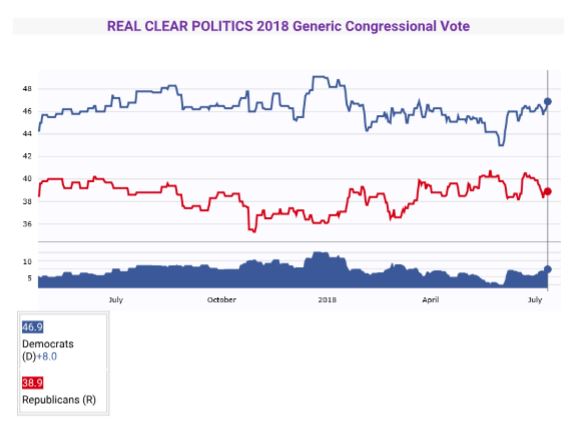
(Credit: Real Clear Politics)
The Democrats’ lead, however, has fluctuated between a high of about 13 points last December to a low of just about four percentage points in late May, and up to eight points these days. Between now and Election Day, we should expect continued fluctuations.
How large does the margin have to be for Democrats to wrest control of the House from Republicans?
To answer the question, we need to look at two factors: 1) how well does the national vote predict the distribution of House seats?; and 2) how well do polls predict the national vote?
The National Vote and the Distribution of House Seats by Party
If we confine our examination to the past half century (starting with 1970), we find that Democrats won a majority of the national vote and a majority of the House seats from 1970 through 1992. In the 1970s, Democrats’ share of House seats was on average about 7 points higher than their share of the national vote; in the 1980s, their average share of seats was about 5 points higher; and in the early 1990s (1990 and 1992), their average share was 7 points higher.
In 1994, however, a new pattern emerged. That was the year that the GOP took majority control of the House for the first time since 1952. Republicans won 53.6% of the national vote and got 52.9% of the House seats – a difference of just 0.7%. And for the next six elections, the differences between a party’s national vote total and its seat total were no greater than 2.2 percentage points. (See table below)
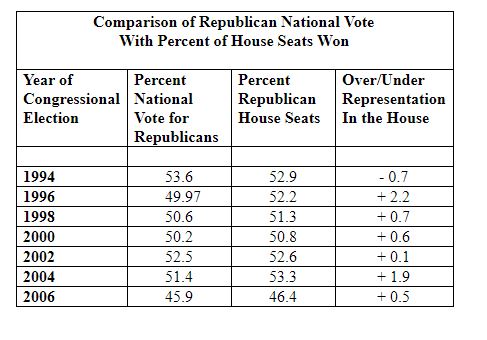
Note that in 1996, Democrats actually won the national vote by about 60,000 votes, but Republicans retained majority control. Still, the over-representation of Republicans in the House, compared with the national vote, was small compared with the over-representation of Democrats during the previous two and a half decades.
In 2008, Republicans lost the national two-party vote with just 44.5%, 1.4 percentage points less than in 2006. But their share of seats dropped by 3.3 points. Put differently, the Democrats won a majority with 55.5% of the vote, and got 59.1% of the seats. That 3.6 percentage point over-representation by Democrats turned out to be an anomaly.
For the next four elections, 2010 through 2016, Republicans have been over-represented in the House, by an average of almost 4.4 percentage points. In 2012, for example, Republicans lost the national two-party vote, but wound up with almost 54% of the seats. And the last election shows Republicans with an over-representation of close to five percentage points.
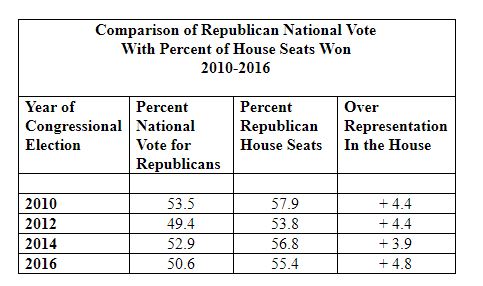
If this pattern, which has been pretty consistent during this decade, continues in 2018, Democrats will have to win about 54.5% of the national two-party vote (45.5% for Republicans) in order to win majority control of the House. That is a 9-point margin of victory.
Currently, as noted earlier, the aggregators of the generic ballot suggest the Democrats are leading by about 8 points, though at times this cycle Democrats have led by double digits.
But how accurate are the predictions of the national two-party vote?
Accuracy of the Generic Ballot
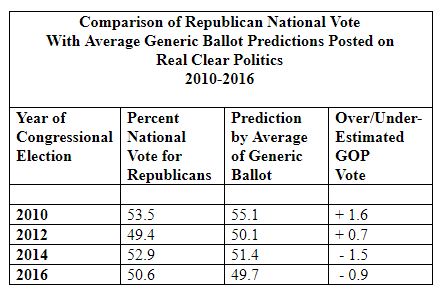
The average generic ballot results, measured just prior to the election, have been remarkably close to the actual two-party national vote. In 2010 and 2012, the generic ballots over-estimated the GOP vote by 1.6 and 0.7 points respectively, while in 2014 and 2016, it underestimated the GOP vote by 1.5 and 0.9 points respectively.
If the current generic ballot average were to prevail in November, and the error favored the Democrats by one or two points, there is a decent probability the Democrats could win majority control. On the other hand, if the ballot is correct, or underestimates Republican strength, and if the pattern of over-representation that has prevailed for the past four elections emerges again this year, the GOP is almost assured of maintaining majority control.
In short, based on the recent history of the generic ballot compared with the national two-party vote and the actual number of House seats won, the Democrats would appear to need a double digit lead in the generic ballot to have a good chance of winning majority control.
What the Generic Ballot May Not Be Telling Us
According to one modeler, G. Elliot Morris, the current generic ballot results do not necessarily reflect the intensity of some voters. As he explains:
“Most generic polls are polls of registered voters, but special election voters aren’t the same as all the registered voters nationwide; according to the current numbers, they’re likely about 10 points more Democratic-leaning.
“Congressional polls that poll likely voters, or those who are enthusiastic about voting, are much more Democratic. So a polling average that doesn’t include them will underestimate Democrat’s advantage in the national political environment.”
Taking into account voter intensity, recent gains by Democrats in special elections, and what the generic ballot results might be close to Election Day, Morris calculates that Democrats have a 76% chance of winning a majority of seats in the House. A separate forecast by The Economist finds Democrats with about a 66% chance.
As Election Day nears, more and more pollsters will base their generic ballot results on likely voters, a subset of the current population of registered voters. If Morris is right, the likely voter population should suggest a stronger outcome for the Democrats than registered voters.
Still, given the potential error in the generic ballot as measured in the polls, and the potential over-representation of Republicans in the House compared with the national vote, a double-digit lead by the Democrats appears to be the crucial metric for the average citizen to follow.
At that level or above, Democrats are highly likely to win control of the House. Below that level, we shouldn’t be surprised whatever party wins.